Tables & Figures in APA Style (6th Edition) | Format & Examples
APA Style has specific guidelines for formatting tables and figures and referring to them in the text.
A table concisely presents information (usually numbers) in rows and columns. A figure is any other image or illustration you include in your text – anything from a bar chart to a photograph.
You can create tables and figures yourself or adapt them from other sources. In both cases the format is the same, but if they come from another source you must acknowledge this and include the source in your reference list.
Tables in APA Style
To correctly format an APA table, follow these rules:
- Table number (in plain text) above the table.
- Brief title (in italics and title case) below the table number.
- Use no vertical lines and as few horizontal lines as possible.
- Notes below the table when necessary.
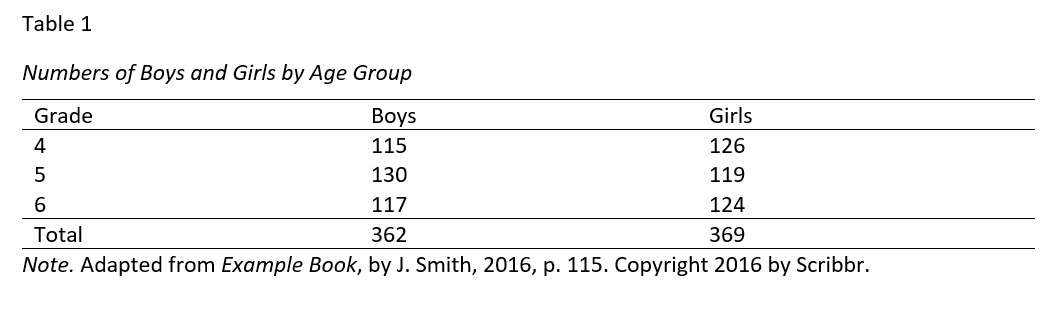
Table number and title
Tables are numbered in the order they are referred to in your text. The title should clearly and straightforwardly describe the table’s content. Omit articles to keep it concise.
The table number appears on its own line, in plain text, followed by the table title on the following line, in italics and title case. For example:
Literacy Rates in European Countries
Table body
Tables will vary in size and structure depending on the data you’re presenting, but APA gives some general guidelines for their design.
Do not use vertical lines, and use only as many horizontal lines as are necessary for clarity. The example in the image above uses only four lines: Those at the top and bottom, and those separating the main data from the column heads and the totals.
Create your tables using the tools built into your word processor. In Word, you can use the “Insert table” tool.
For column and row headings, use concise and clear labels. Be consistent in the way you present numbers – for example, display the same number of decimal places for each item.
Table notes
Below your table, if necessary, include notes to explain the table. These are not your analysis of the data presented; save that for the main text.
Notes come in three varieties: general, specific, and probability notes.
General notes come first. They are preceded by the word ‘Note’ in italics, followed by a period. They include any explanations that apply to the table as a whole and acknowledgements if the table was adapted from another source, and they end with definitions of any abbreviations used:
Note that where tables are adapted from other sources, these sources should also appear on the reference page.
Specific notes are those that refer to specific points in the table. Superscript letters (a, b, c …) appear at the relevant points in the table and at the start of each note to indicate what they refer to. They are used when it’s necessary to comment on a specific data point or term in the table:
Probability notes give p values for the data in the table. They correspond to asterisks (and/or other symbols) in the table:
Each type of note appears in a new paragraph, but multiple notes of the same kind all appear in one paragraph.
Only include the notes that are needed to understand your data. It may be that your table is clear in itself, and has no notes, or only probability notes; be as concise as possible.


Figures in APA Style
Any images used within your text are called figures. Figures include data visualization graphics – graphs, diagrams, flow-charts, etc. – as well as things like photographs and artworks.
To correctly format an APA figure, follow these rules:
- Labels and legends within the image in the same font and size as the main text.
- Figure number below the image, in italics and followed by a period.
- Figure caption on the same line, in plain text and followed by a period.
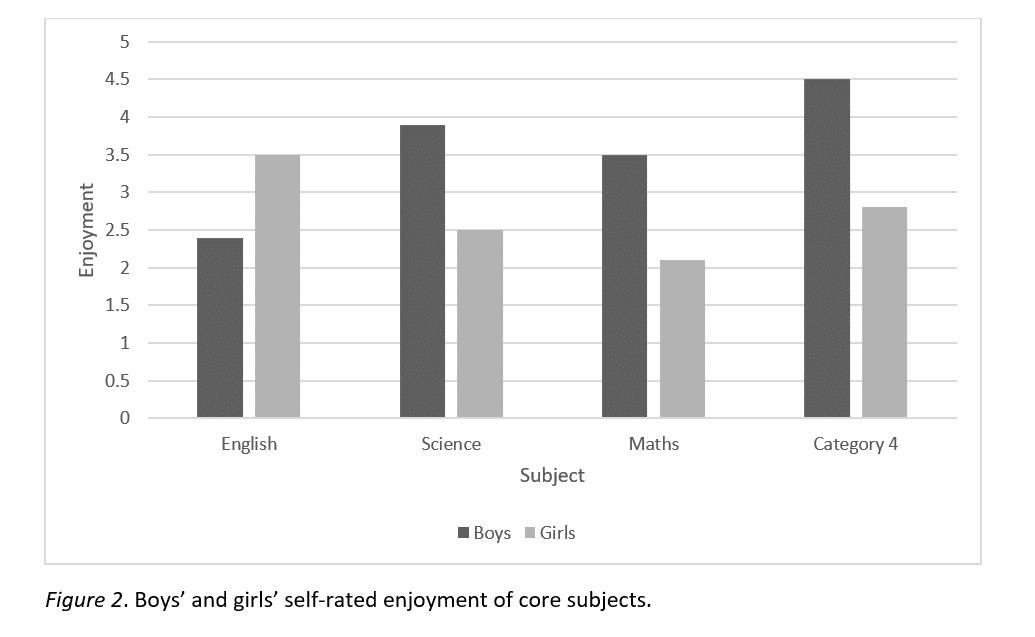
Figure and legend
The figure itself appears first. If it’s an infographic, it will usually include labels for the different elements of the graphic, and may also include a legend explaining the meaning of any symbols, colors and shading that cannot be directly labelled. For example, the “Boys” and “Girls” text in the above example is a legend. All of this should be integrated into the image itself.
Keep the design of figures as simple as possible. Use colors only where necessary, not just to make the image look more appealing. For labels and legends, use the same font and font size as in your main text.
For other figures, such as photographs, you won’t need a legend; the figure consists simply of the image itself, reproduced at an appropriate size and resolution.
Figure number and caption
Below the figure, place the figure number and caption:
Figures are numbered in the order they are referred to in the text. The figure number appears in italics.
The caption appears immediately after the number (no line break), and is written in plain text, with sentence case capitalization. The caption should give the title of the image or, if there is no title, a short description.
The caption also provides any additional notes, such as legend information that could not be included in the figure itself, and acknowledgements if the figure was adapted from another source.
Where to place tables and figures
You have two options for the placement of tables and figures in APA Style:
- Option 1: Place tables and figures throughout your text, close to the parts of the text that refer to them.
- Option 2: Place them all together at the end of your text (after the reference list) to avoid breaking up the text.
If you place them throughout the text, note that each table or figure should only appear once. If you refer to the same table or figure more than once, don’t reproduce it each time – just place it after the paragraph in which it’s first discussed.
Leave a line break after the table or figure to clearly distinguish the main text from the caption or notes, and place the table or figure on a new page if necessary to avoid splitting it across multiple pages.
If you place all your tables and figures at the end, you should have one table or figure on each page. Begin with all your tables, then place all your figures afterwards.
Referring to tables and figures in the text
Avoid making redundant statements about your tables and figures in your text. When you write about data from tables and figures, it should be to highlight or analyze a particular data point or trend, not simply to restate what is already clearly shown in the table or figure:
- As Table 1 shows, there are 115 boys in Grade 4, 130 in Grade 5, and 117 in Grade 6 …
- Table 1 indicates a notable preponderance of boys in Grade 5. It is important to take this into account because …
Additionally, even if you have embedded your tables and figures in your text, refer to them by their numbers, not by their position relative to the text or by description:
- The table below shows…
- Table 1 shows…
- As can be seen in the image on page 4…
- As can be seen in Figure 3…
- The photograph of a bald eagle is an example of…
- Figure 1 is an example of…
Cite this Scribbr article
If you want to cite this source, you can copy and paste the citation or click the “Cite this Scribbr article” button to automatically add the citation to our free Citation Generator.
Caulfield, J. (2020, November 03). Tables & Figures in APA Style (6th Edition) | Format & Examples. Scribbr. Retrieved June 23, 2026, from https://www.scribbr.com/apa-style/6th-edition/archived-tables-and-figures/