Published on
December 8, 2021
by
Pritha Bhandari.
Revised on
January 14, 2025.
Missing data, or missing values, occur when you don’t have data stored for certain variables or participants. Data can go missing due to incomplete data entry, equipment malfunctions, lost files, and many other reasons.
In any dataset, there are usually some missing data. In quantitative research, missing values appear as blank cells in your spreadsheet.
Published on
December 2, 2021
by
Pritha Bhandari.
Revised on
June 21, 2023.
The geometric mean is an average that multiplies all values and finds a root of the number. For a dataset with n numbers, you find the nth root of their product. You can use this descriptive statistic to summarize your data.
The geometric mean is an alternative to the arithmetic mean, which is often referred to simply as “the mean.” While the arithmetic mean is based on adding values, the geometric mean multiplies values.
Published on
November 30, 2021
by
Pritha Bhandari.
Revised on
January 17, 2024.
Outliers are extreme values that differ from most other data points in a dataset. They can have a big impact on your statistical analyses and skew the results of any hypothesis tests.
It’s important to carefully identify potential outliers in your dataset and deal with them in an appropriate manner for accurate results.
Published on
November 23, 2021
by
Pritha Bhandari.
Revised on
January 14, 2025.
Data cleansing involves spotting and resolving potential data inconsistencies or errors to improve your data quality. An error is any value (e.g., recorded weight) that doesn’t reflect the true value (e.g., actual weight) of whatever is being measured.
In this process, you review, analyze, detect, modify, or remove “dirty” data to make your dataset “clean.” Data cleansing is also called data cleaning or data scrubbing.
Published on
November 1, 2021
by
Pritha Bhandari.
Revised on
March 4, 2023.
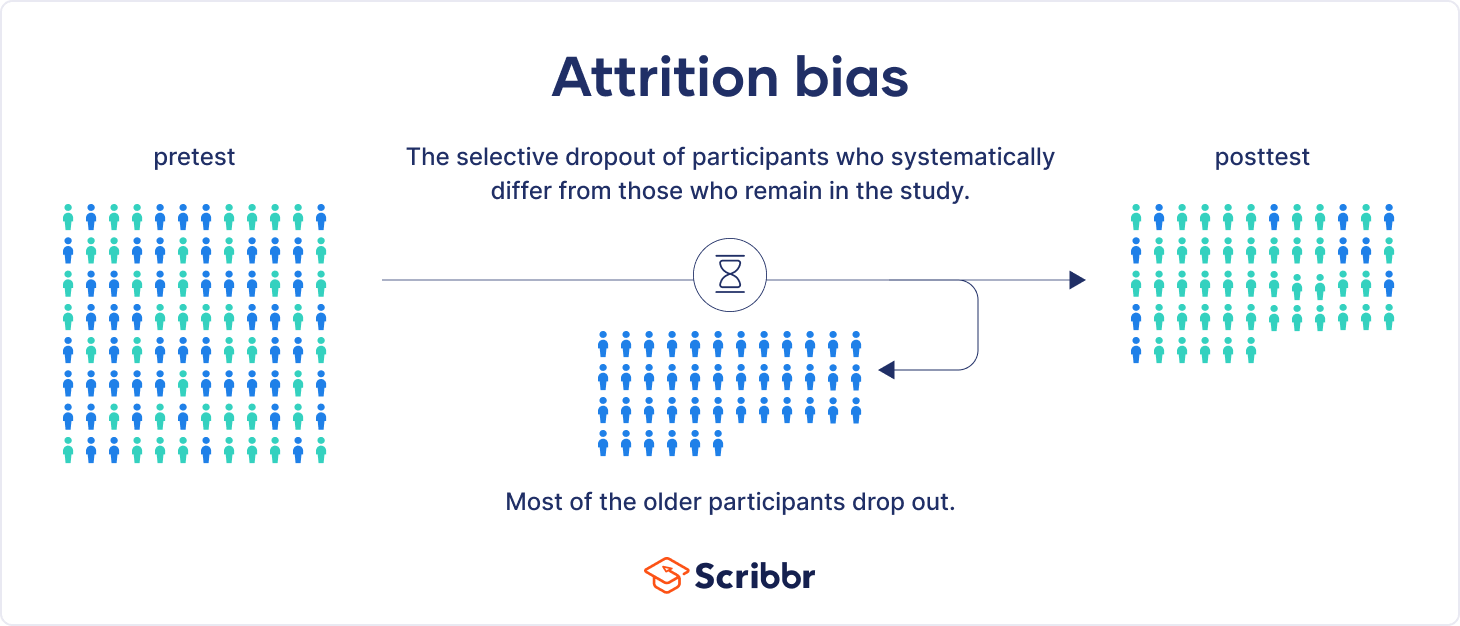
Attrition is participant dropout over time in research studies. It’s also called subject mortality, but it doesn’t always refer to participants dying!
Almost all longitudinal studies will have some dropout, but the type and scale of the dropout can cause problems. Attrition bias is the selective dropout of some participants who systematically differ from those who remain in the study.
Attrition bias is especially problematic in randomized controlled trials for medical research.
Published on
October 20, 2021
by
Pritha Bhandari.
Revised on
March 13, 2023.
In research, demand characteristics are cues that might indicate the research objectives to participants. These cues can lead participants to change their behaviors or responses based on what they think the research is about.
Demand characteristics are problematic because they can bias your research findings. They commonly occur in psychology experiments and social sciences studies because these involve human participants.
It’s important to consider potential demand characteristics in your research design and deal with them appropriately to obtain valid results.
Published on
October 18, 2021
by
Pritha Bhandari.
Revised on
October 1, 2024.
Ethical considerations in research are a set of principles that guide your research designs and practices. Scientists and researchers must always adhere to a certain code of conduct when collecting data from people.
The goals of human research often include understanding real-life phenomena, studying effective treatments, investigating behaviors, and improving lives in other ways. What you decide to research and how you conduct that research involve key ethical considerations.
Published on
August 16, 2021
by
Pritha Bhandari.
Revised on
June 22, 2023.
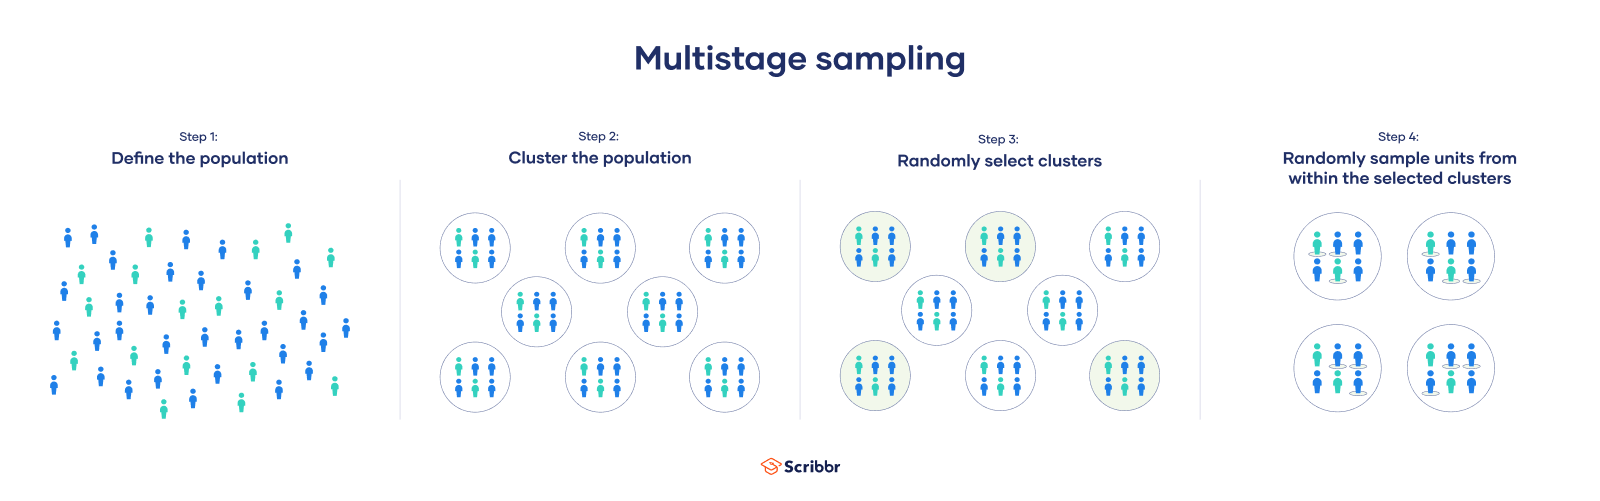
In multistage sampling, or multistage cluster sampling, you draw a sample from a population using smaller and smaller groups (units) at each stage. It’s often used to collect data from a large, geographically spread group of people in national surveys.
Published on
July 15, 2021
by
Pritha Bhandari.
Revised on
June 22, 2023.
A questionnaire is a list of questions or items used to gather data from respondents about their attitudes, experiences, or opinions. Questionnaires can be used to collect quantitative and/or qualitative information.
Questionnaires are commonly used in market research as well as in the social and health sciences. For example, a company may ask for feedback about a recent customer service experience, or psychology researchers may investigate health risk perceptions using questionnaires.