How to Find the Geometric Mean | Calculator & Formula
The geometric mean is an average that multiplies all values and finds a root of the number. For a dataset with n numbers, you find the nth root of their product. You can use this descriptive statistic to summarize your data.
The geometric mean is an alternative to the arithmetic mean, which is often referred to simply as “the mean.” While the arithmetic mean is based on adding values, the geometric mean multiplies values.
Table of contents
- Geometric mean calculator
- Geometric mean formula
- Calculating the geometric mean
- When should you use the geometric mean?
- Example: Geometric mean of percentages
- Example: Geometric mean of widely varying values
- Geometric mean vs. arithmetic mean
- When is the geometric mean better than the arithmetic mean?
- Other interesting articles
- Frequently asked questions about central tendency
Geometric mean calculator
You can calculate the geometric mean by hand or with the help of our geometric mean calculator below.
Here's why students love Scribbr's proofreading services
Geometric mean formula
The geometric mean formula can be written in two ways, but they are equivalent mathematically.
![\begin{equation*} \sqrt[n]{\Pi x}=(\Pi x)^\frac{1}{ n} \end{equation*}](https://www.scribbr.com/wp-content/ql-cache/quicklatex.com-0298bfe02e8e3c644986517c677fce96_l3.png "Rendered by QuickLaTeX.com")
 = product of …
 = every value
 = total number of values
 = reciprocal of
 = every value
 = total number of values
 = reciprocal of
 The symbol pi ( ) is similar to the summation sign sigma (Σ), but instead it tells you to find the product of what follows after it by multiplying them all together.
In the first formula, the geometric mean is the nth root of the product of all values.
In the second formula, the geometric mean is the product of all values raised to the power of the reciprocal of n.
These formulas are equivalent because of the laws of exponents: taking the nth root of x is exactly the same as raising x to the power of 1/n.
Calculating the geometric mean
There are two main steps to calculating the geometric mean:
- Multiply all values together to get their product.
- Find the nth root of the product (n is the number of values).
Before calculating this measure of central tendency, note that:
- The geometric mean can only be found for positive values.
- If any value in the dataset is zero, the geometric mean is zero.
When should you use the geometric mean?
The geometric mean is best for reporting average inflation, percentage change, and growth rates. Because these types of data are expressed as fractions, the geometric mean is more accurate for them than the arithmetic mean.
While the arithmetic mean is appropriate for values that are independent from each other (e.g., test scores), the geometric mean is more appropriate for dependent values, percentages, fractions, or widely ranging data.
We’ll walk you through some examples showing how to find the geometric means of different types of data.
Here's why students love Scribbr's proofreading services
Example: Geometric mean of percentages
You’re interested in the average voter turnout of the past five US elections. You’ve gathered the following data.
| Year | 2000 | 2004 | 2008 | 2012 | 2016 |
|---|---|---|---|---|---|
| Voter turnout (%) | 50.3 | 55.7 | 57.1 | 54.9 | 60.1 |
Step 1: Multiply all values together to get their product.
| Formula | Calculation |
|---|---|
 |
 |
Step 2: Find the nth root of the product (n is the number of values).
| Formula | Calculation |
|---|---|
![\sqrt[n]{\Pi x}](https://www.scribbr.com/wp-content/ql-cache/quicklatex.com-33500c0945f21cd0106342110f0e6cac_l3.png "Rendered by QuickLaTeX.com") |
  ![\sqrt[n]{\Pi x}=\sqrt[5]{487\,443\,873.24}=54.64](https://www.scribbr.com/wp-content/ql-cache/quicklatex.com-43647bf87b0e39b1dd3d088985036f9a_l3.png "Rendered by QuickLaTeX.com") |
The average voter turnout of the past five US elections was 54.64%.
Example: Geometric mean of widely varying values
You compare the efficiency of two machines for three procedures that are assessed on different scales. To find the mean efficiency of each machine, you find the geometric and arithmetic means of their procedure rating scores.
| Procedure 1 | Procedure 2 | Procedure 3 | |
|---|---|---|---|
| Machine A | 7 | 80 | 2100 |
| Machine B | 3 | 94 | 2350 |
Geometric mean of Machine A
Step 1: Multiply all values together to get their product.
| Formula | Calculation |
|---|---|
|
 |
Step 2: Find the nth root of the product (n is the number of values).
| Formula | Calculation |
|---|---|
|
  ![\sqrt[n]{\Pi x}=\sqrt[3]{1\,176\,000}=105.55](https://www.scribbr.com/wp-content/ql-cache/quicklatex.com-e141ce808f8c9a03661e9ffc02951304_l3.png "Rendered by QuickLaTeX.com") |
Geometric mean of Machine B
Step 1: Multiply all values together to get their product.
| Formula | Calculation |
|---|---|
|
 |
Step 2: Find the nth root of the product (n is the number of values).
| Formula | Calculation |
|---|---|
|
 ![\sqrt[n]{\Pi x}=\sqrt[3]{662\,700}=87.18](https://www.scribbr.com/wp-content/ql-cache/quicklatex.com-ea96fa25417ff58aac0be6ef0b43f2dd_l3.png "Rendered by QuickLaTeX.com") |
Comparing the means
Now you compare machine efficiency using arithmetic and geometric means.
| Arithmetic mean | Geometric mean | |
|---|---|---|
| Machine A | 729 | 105.55 |
| Machine B | 815.67 | 87.18 |
While the arithmetic means show higher efficiency for Machine B, the geometric means show that Machine B is more efficient.
The geometric mean is more accurate here because the arithmetic mean is skewed towards values that are higher than most of your dataset.
Geometric mean vs. arithmetic mean
The geometric mean is more accurate than the arithmetic mean for showing percentage change over time or compound interest.
For example, say you study fruit fly population growth rates. You’re interested in understanding how environmental factors change these rates.
You begin with 2 fruit flies, and every 12 days you measure the percentage increase in the population.
Each percentage change value is also converted into a growth factor that is in decimals. The growth factor includes the original value (100%), so to convert percentage increase into a growth factor, add 100 to each percentage increase and divide by 100.
| Day | 12 | 24 | 36 |
|---|---|---|---|
| Percentage increase | 340 | 187 | 427 |
| Growth factor | 4.4 | 2.87 | 5.27 |
First, you convert percentage change into decimals. You add 100 to each value to factor in the original amount, and divide each value by 100.
Arithmetic mean
To find the arithmetic mean, add up all values and divide this number by n.
| Formula | Calculation |
|---|---|
|
|
  |

Geometric mean
Step 1: Multiply all values together to get their product.
| Formula | Calculation |
|---|---|
|
 |
Step 2: Find the nth root of the product (n is the number of values).
| Formula | Calculation |
|---|---|
|
 ![\sqrt[n]{\Pi x}\approx4.05](https://www.scribbr.com/wp-content/ql-cache/quicklatex.com-b3ce74542f44d3653c46edc858f65d41_l3.png "Rendered by QuickLaTeX.com") |
The arithmetic mean population growth factor is 4.18, while the geometric mean growth factor is 4.05.
How do we know which mean is correct?
Because they are averages, multiplying the original number of flies with the mean percentage change 3 times should give us the correct final population value for the correct mean.
- Final population value: 2 × 4.4 × 2.87 × 5.27 ≈ 133 fruit flies
- Arithmetic mean of 418%: Final population = 2 × 4.18 × 4.18 × 4.18 ≈ 157 fruit flies
- Geometric mean of 405%: Final population = 2 × 4.05 × 4.05 × 4.05 ≈ 133 fruit flies
Only the geometric mean gives us the true number of fruit flies in the final population. It’s the most accurate mean for the growth factor.
When is the geometric mean better than the arithmetic mean?
Even though it’s less commonly used, the geometric mean is more accurate than the arithmetic mean for positively skewed data and percentages.
In a positively skewed distribution, there’s a cluster of lower scores and a spread-out tail on the right. Income distribution is a common example of a skewed dataset.
While most values tend to be low, the arithmetic mean is often pulled upward (or rightward) by high values or outliers in a positively skewed dataset.
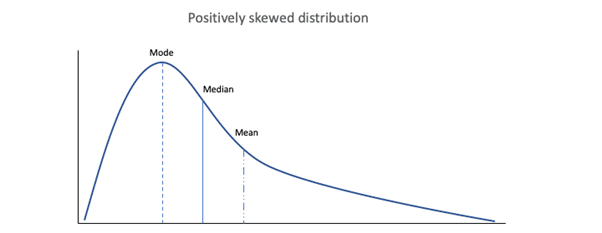
Because the geometric mean tends to be lower than the arithmetic mean, it represents smaller values better than the arithmetic mean.
The geometric mean is most appropriate for ratio levels of measurement, where variables have a true zero and don’t take on any negative values. Negative percentage changes have to be framed positively: for instance, −8% becomes 92% of the original value.
Other interesting articles
If you want to know more about statistics, methodology, or research bias, make sure to check out some of our other articles with explanations and examples.
Statistics
Methodology
Frequently asked questions about central tendency
Cite this Scribbr article
If you want to cite this source, you can copy and paste the citation or click the “Cite this Scribbr article” button to automatically add the citation to our free Citation Generator.
Bhandari, P. (2023, June 21). How to Find the Geometric Mean | Calculator & Formula. Scribbr. Retrieved July 9, 2026, from https://www.scribbr.com/statistics/geometric-mean/
