How to Find the Mode | Definition, Examples & Calculator
The mode or modal value of a data set is the most frequently occurring value. It’s a measure of central tendency that tells you the most popular choice or most common characteristic of your sample.
When reporting descriptive statistics, measures of central tendency help you find the middle or the average of your data set. The three most common measures of central tendency are the mode, median, and mean.
How many modes can you have?
A data set can often have no mode, one mode or more than one mode – it all depends on how many different values repeat most frequently.
Your data can be:
- without any mode
- unimodal, with one mode,
- bimodal, with two modes,
- trimodal, with three modes, or
- multimodal, with four or more modes.
Here's why students love Scribbr's proofreading services
Mode calculator
You can calculate the mode by hand or with the help of our mode calculator below.
Find the mode (by hand)
To find the mode, follow these two steps:
- If the data for your variable takes the form of numerical values, order the values from low to high. If it takes the form of categories or groupings, sort the values by group, in any order.
- Identify the value or values that occur most frequently.
Numerical mode example
Your data set is the ages of 6 college students.
| Participant | A | B | C | D | E | F |
|---|---|---|---|---|---|---|
| Age | 19 | 22 | 20 | 21 | 22 | 23 |
By ordering the values from low to high, we can easily see the value that occurs most frequently.
| Age | 19 | 20 | 21 | 22 | 22 | 23 |
|---|
The mode of this data set is 22.
Categorical mode example
Your data set contains the highest education levels of the participants’ parents.
| Participant | A | B | C | D | E | F |
|---|---|---|---|---|---|---|
| Parents’ education level | Bachelor’s degree | Master’s degree | High school diploma | Bachelor’s degree | Doctoral degree | Master’s degree |
To sort the values by group, you create a simple frequency table. Place the categories on the left hand side and the frequencies on the right hand side.
| Parents’ education level | Frequency |
|---|---|
| Bachelor’s degree | 2 |
| Master’s degree | 2 |
| High school diploma | 1 |
| Doctoral degree | 1 |
From the table, you can see that there are two modes. This means you have a bimodal data set.
The modes are Bachelor’s degree and Master’s degree.
Find the mode with grouped data
A grouped frequency table organizes large numerical data sets into intervals or classes of values and reports the frequency of values in each class.
For grouped data, you can report the mode in two ways:
- the modal class is the grouping with the highest frequency of values.
- the modal value is estimated as the midpoint of the modal class.
The mode is only an estimate in this case, because the actual values within the modal class are unknown.
Modal class and modal value example
You have a data set that includes the average reaction times of participants. You organize the data into a frequency table.
Reaction times are placed in classes of 100 milliseconds each. The frequency column shows the number of participants within each class.
| Reaction time (milliseconds) | Frequency |
|---|---|
| 200–299 | 6 |
| 300–399 | 13 |
| 400–499 | 17 |
| 500–599 | 25 |
| 600–699 | 21 |
| 700–799 | 12 |
| 800–899 | 4 |
You can visualize your data set by plotting your data on a histogram. The mode is the value with the highest peak on a histogram or bar chart.
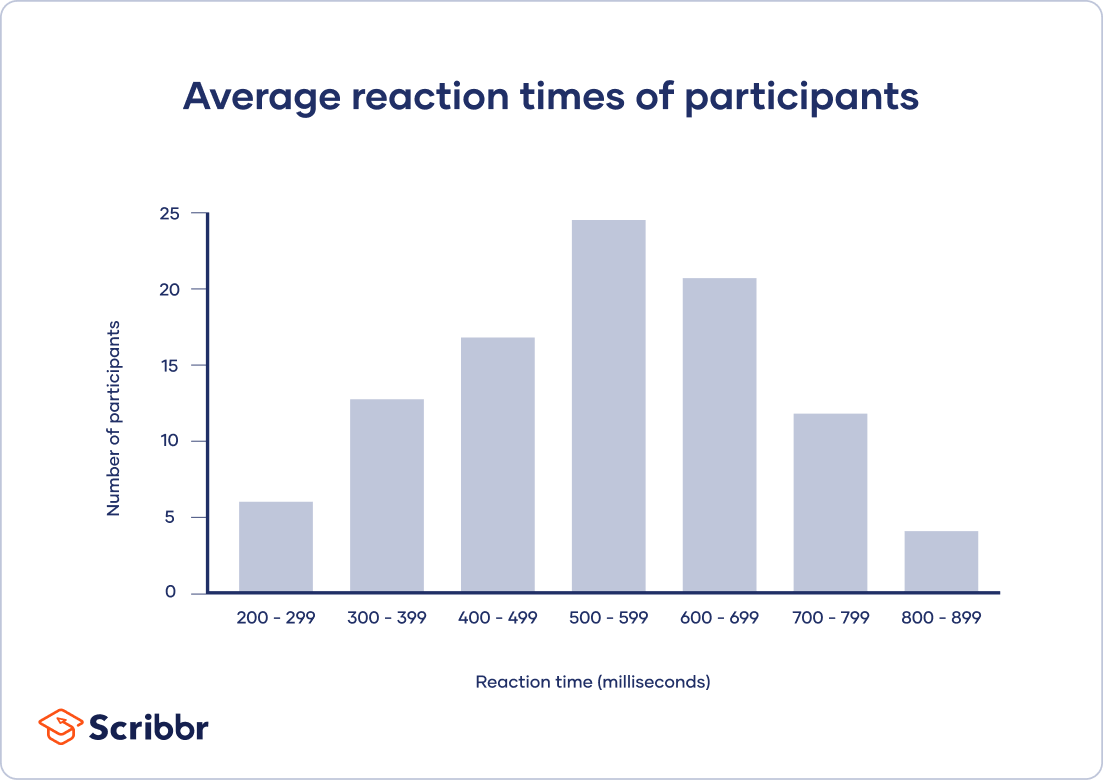
From your table or histogram, you can see that the modal class – the group in which values appear most frequently – is 500–599 milliseconds. Therefore, the mode is estimated to be at the midpoint of this class: 550 milliseconds.
Importantly, the choice of intervals in grouped data can have a large impact on the mode. For example, changing the intervals from 100 ms long to 50 or 200 ms long could result in completely different modes.

When to use the mode
The level of measurement of your variables determines when you should use the mode.
The mode works best with categorical data. It is the only measure of central tendency for nominal variables, where it can reflect the most commonly found characteristic (e.g., demographic information). The mode is also useful with ordinal variables – for example, to reflect the most popular answer on a ranked scale (e.g., level of agreement).
For quantitative data, such as reaction time or height, the mode may not be a helpful measure of central tendency. That’s because there are often many more possible values for quantitative data than there are for categorical data, so it’s unlikely for values to repeat.
Example of quantitative data with no mode
You collect data on reaction times in a computer task, and your data set contains values that are all different from each other.
| Reaction time (milliseconds) | 267 | 345 | 421 | 324 | 401 | 312 | 382 | 298 | 303 |
|---|
In this data set, there is no mode, because each value occurs only once.
Other interesting articles
If you want to know more about statistics, methodology, or research bias, make sure to check out some of our other articles with explanations and examples.
Statistics
Methodology
Frequently asked questions about the mode
Cite this Scribbr article
If you want to cite this source, you can copy and paste the citation or click the “Cite this Scribbr article” button to automatically add the citation to our free Citation Generator.
Bhandari, P. (2023, June 21). How to Find the Mode | Definition, Examples & Calculator. Scribbr. Retrieved July 9, 2026, from https://www.scribbr.com/statistics/mode/
