Coefficient of Determination (R²) | Calculation & Interpretation
The coefficient of determination is a number between 0 and 1 that measures how well a statistical model predicts an outcome.
| Coefficient of determination (R2) | Interpretation |
|---|---|
| 0 | The model does not predict the outcome. |
| Between 0 and 1 | The model partially predicts the outcome. |
| 1 | The model perfectly predicts the outcome. |
The coefficient of determination is often written as R2, which is pronounced as “r squared.” For simple linear regressions, a lowercase r is usually used instead (r2).
What is the coefficient of determination?
The coefficient of determination (R²) measures how well a statistical model predicts an outcome. The outcome is represented by the model’s dependent variable.
The lowest possible value of R² is 0 and the highest possible value is 1. Put simply, the better a model is at making predictions, the closer its R² will be to 1.
- If the R2 is 0, the linear regression model doesn’t allow you to predict exam scores any better than simply estimating that everyone has an average exam score.
- If the R2 is between 0 and 1, the model allows you to partially predict exam scores. The model’s estimates are not perfect, but they’re better than simply using the average exam score.
- If the R2 is 1, the model allows you to perfectly predict anyone’s exam score.
More technically, R2 is a measure of goodness of fit. It is the proportion of variance in the dependent variable that is explained by the model.
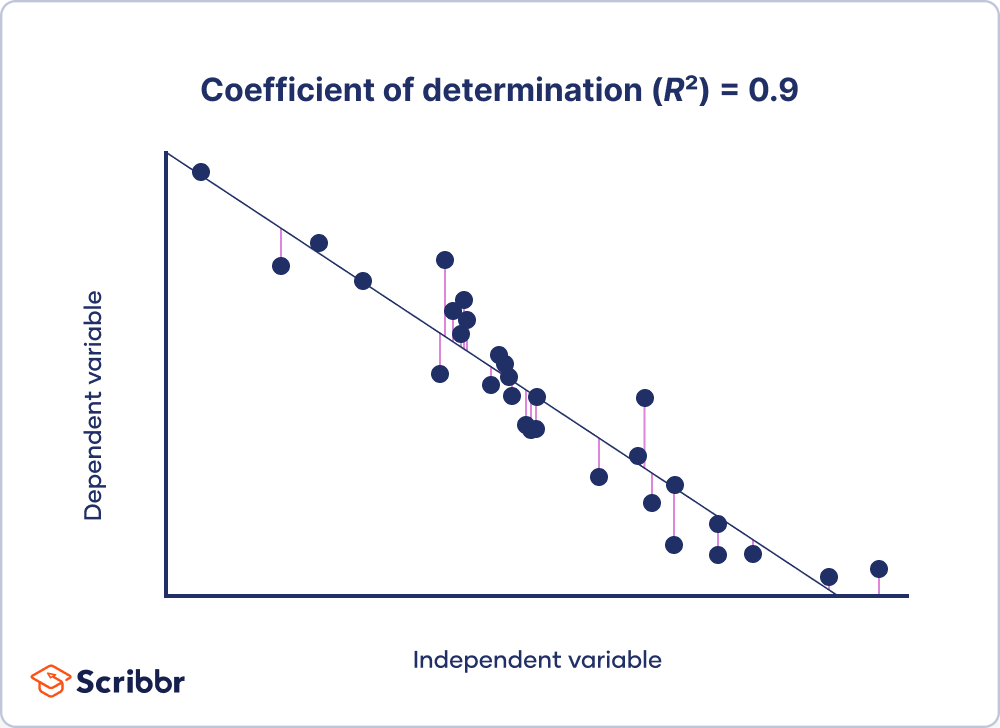
Graphing your linear regression data usually gives you a good clue as to whether its R2 is high or low. For example, the graphs below show two sets of simulated data:
- The observations are shown as dots.
- The model’s predictions (the line of best fit) are shown as a black line.
- The distance between the observations and their predicted values (the residuals) are shown as purple lines.
You can see in the first dataset that when the R2 is high, the observations are close to the model’s predictions. In other words, most points are close to the line of best fit:
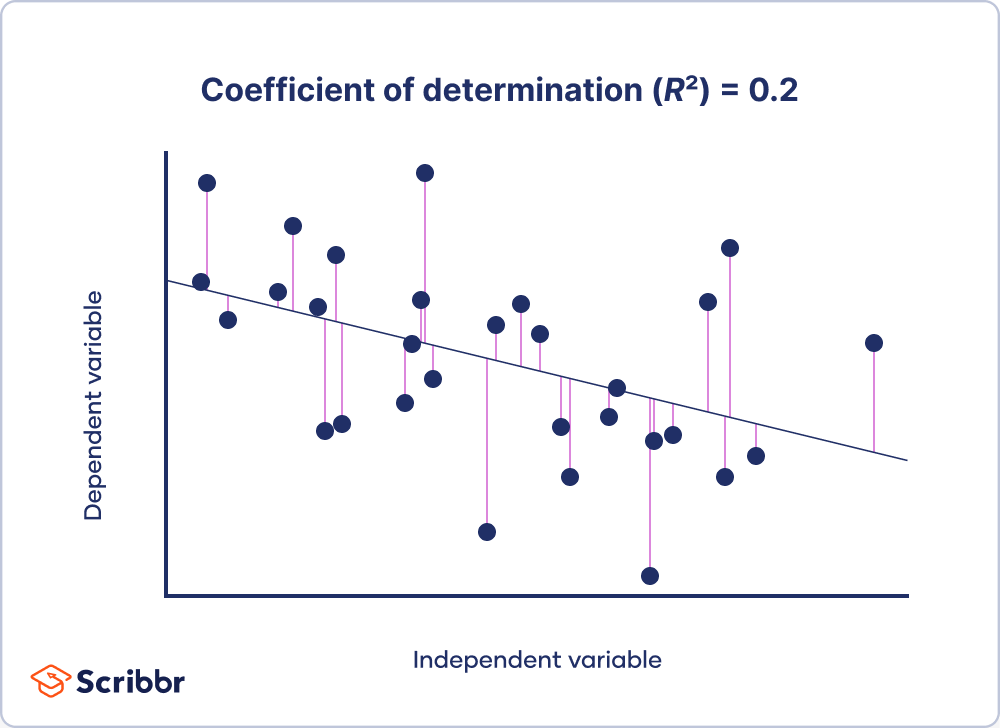
In contrast, you can see in the second dataset that when the R2 is low, the observations are far from the model’s predictions. In other words, when the R2 is low, many points are far from the line of best fit:

Calculating the coefficient of determination
You can choose between two formulas to calculate the coefficient of determination (R²) of a simple linear regression. The first formula is specific to simple linear regressions, and the second formula can be used to calculate the R² of many types of statistical models.
Formula 1: Using the correlation coefficient

Where r = Pearson correlation coefficient

This value can be used to calculate the coefficient of determination (R²) using Formula 1:


Formula 2: Using the regression outputs

Where:
- RSS = sum of squared residuals
- TSS = total sum of squares


These values can be used to calculate the coefficient of determination (R²) using Formula 2:


Interpreting the coefficient of determination
You can interpret the coefficient of determination (R²) as the proportion of variance in the dependent variable that is predicted by the statistical model.
Another way of thinking of it is that the R² is the proportion of variance that is shared between the independent and dependent variables.
You can also say that the R² is the proportion of variance “explained” or “accounted for” by the model. The proportion that remains (1 − R²) is the variance that is not predicted by the model.
If you prefer, you can write the R² as a percentage instead of a proportion. Simply multiply the proportion by 100.
R² as an effect size
Lastly, you can also interpret the R² as an effect size: a measure of the strength of the relationship between the dependent and independent variables. Psychologist and statistician Jacob Cohen (1988) suggested the following rules of thumb for simple linear regressions:
| Minimum coefficient of determination (R²) value | Effect size interpretation |
|---|---|
| .01 | Small |
| .09 | Medium |
| .25 | Large |
Be careful: the R² on its own can’t tell you anything about causation.
- 71% of the variance in students’ exam scores is predicted by their study time
- 29% of the variance in student’s exam scores is unexplained by the model
- The students’ study time has a large effect on their exam scores
Studying longer may or may not cause an improvement in the students’ scores. Although this causal relationship is very plausible, the R² alone can’t tell us why there’s a relationship between students’ study time and exam scores.
For example, students might find studying less frustrating when they understand the course material well, so they study longer.
Reporting the coefficient of determination
If you decide to include a coefficient of determination (R²) in your research paper, dissertation or thesis, you should report it in your results section. You can follow these rules if you want to report statistics in APA Style:
- You should use “r²” for statistical models with one independent variable (such as simple linear regressions). Use “R²” for statistical models with multiple independent variables.
- You don’t need to provide a reference or formula since the coefficient of determination is a commonly used statistic.
- You should italicize r² and R² when reporting their values (but don’t italicize the ²).
- You shouldn’t include a leading zero (a zero before the decimal point) since the coefficient of determination can’t be greater than one.
- You should provide two significant digits after the decimal point.
- Very often, the coefficient of determination is provided alongside related statistical results, such as the F value, degrees of freedom, and p value.
Practice questions
Other interesting articles
If you want to know more about statistics, methodology, or research bias, make sure to check out some of our other articles with explanations and examples.
Statistics
Methodology
Frequently asked questions about the coefficient of determination


Cite this Scribbr article
If you want to cite this source, you can copy and paste the citation or click the “Cite this Scribbr article” button to automatically add the citation to our free Citation Generator.
Turney, S. (2023, June 22). Coefficient of Determination (R²) | Calculation & Interpretation. Scribbr. Retrieved July 25, 2026, from https://www.scribbr.com/statistics/coefficient-of-determination/