Ordinal Data | Definition, Examples, Data Collection & Analysis
Ordinal data is classified into categories within a variable that have a natural rank order. However, the distances between the categories are uneven or unknown.
For example, the variable “frequency of physical exercise” can be categorized into the following:
| 1. Never | 2. Rarely | 3. Sometimes | 4. Often | 5. Always |
There is a clear order to these categories, but we cannot say that the difference between “never” and “rarely” is exactly the same as that between “sometimes” and “often”. Therefore, this scale is ordinal.
Levels of measurement
Ordinal is the second of 4 hierarchical levels of measurement: nominal, ordinal, interval, and ratio. The levels of measurement indicate how precisely data is recorded.
While nominal and ordinal variables are categorical, interval and ratio variables are quantitative.
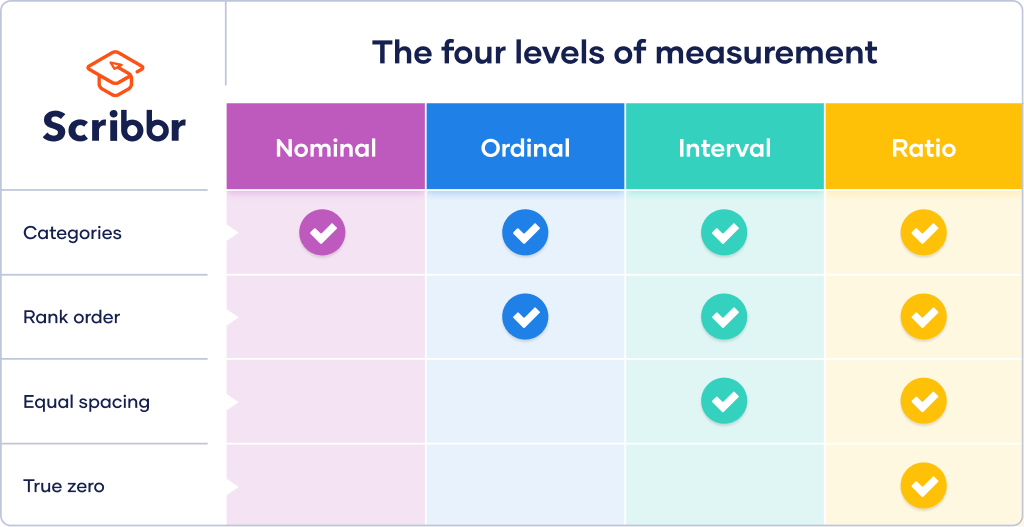
Nominal data differs from ordinal data because it cannot be ranked in an order. Interval data differs from ordinal data because the differences between adjacent scores are equal.
Here's why students love Scribbr's proofreading services
Examples of ordinal scales
In social scientific research, ordinal variables often include ratings about opinions or perceptions, or demographic factors that are categorized into levels or brackets (such as social status or income).
| Variable | Ordinal values |
|---|---|
| Language ability |
|
| Level of agreement |
|
| Income level |
|
How to collect ordinal data
Ordinal variables are usually assessed using closed-ended survey questions that give participants several possible answers to choose from. These are user-friendly and let you easily compare data between participants.
| Question | Options |
|---|---|
| What is your age? |
|
| What is your education level? |
|
| In the past three months, how many times did you buy groceries online? |
|
Choosing the level of measurement
Some types of data can be recorded at more than one level. For example, for the variable of age:
- You could collect ordinal data by asking participants to select from four age brackets, as in the question above.
- You could collect ratio data by asking participants for their exact age.
The more precise level is always preferable for collecting data because it allows you to perform more mathematical operations and statistical analyses.
Likert scale data
In the social sciences, ordinal data is often collected using Likert scales. Likert scales are made up of 4 or more Likert-type questions with continuums of response items for participants to choose from.
| How frequently do you buy energy efficient products? | ||||
|---|---|---|---|---|
| Never | Rarely | Sometimes | Often | Always |
| How important do you think it is to reduce your carbon footprint? | ||||
| Not important | Slightly important | Important | Moderately important | Very important |
Since these values have a natural order, they are sometimes coded into numerical values. For example, 1 = Never, 2 = Rarely, 3 = Sometimes, 4 = Often, and 5 = Always.
But it’s important to note that not all mathematical operations can be performed on these numbers. Although you can say that two values in your data set are equal or unequal (= or ≠) or that one value is greater or less than another (< or >), you cannot meaningfully add or subtract the values from each other.
This becomes relevant when gathering descriptive statistics about your data.
How to analyze ordinal data
Ordinal data can be analyzed with both descriptive and inferential statistics.
Descriptive statistics
You can use these descriptive statistics with ordinal data:
- the frequency distribution in numbers or percentages,
- the mode or the median to find the central tendency,
- the range to indicate the variability.
| Regular physical exercise is important for my mental health. | ||||
|---|---|---|---|---|
| Strongly disagree | Disagree | Neither disagree nor agree | Agree | Strongly agree |
To get an overview of your data, you can create a frequency distribution table that tells you how many times each response was selected.
| Agreement level | Frequency |
|---|---|
| Strongly disagree | 2 |
| Disagree | 2 |
| Neither disagree nor agree | 8 |
| Agree | 13 |
| Strongly agree | 5 |
To visualize your data, you can present it on a bar graph. Plot your categories on the x-axis and the frequencies on the y-axis.
Unlike with nominal data, the order of categories matters when displaying ordinal data.

Central tendency
The central tendency of your data set is where most of your values lie. The mode, mean, and median are three most commonly used measures of central tendency.
While the mode can almost always be found for ordinal data, the median can only be found in some cases.
The mean cannot be computed with ordinal data. Finding the mean requires you to perform arithmetic operations like addition and division on the values in the data set. Since the differences between adjacent scores are unknown with ordinal data, these operations cannot be performed for meaningful results.
In the current data set, the mode is Agree
The medians for odd- and even-numbered data sets are found in different ways.
- In an odd-numbered data set, the median is the value at the middle of your data set when it is ranked.
- In an even-numbered data set, the median is the mean of the two values at the middle of your data set.
Since there are 30 values, there are 2 values in the middle at the 15th and 16th positions. Both of these values are the same, so the median is Agree.
Now, suppose the two values in the middle were Agree and Strongly agree instead. How would you find the mean of these two values?
Since addition or division isn’t possible, the mean can’t be found for these two values even if you coded them numerically. There is no median in this case.
Variability
To assess the variability of your data set, you can find the minimum, maximum and range. You will need to numerically code your data for these.
- 1 = Strongly disagree
- 2 = Disagree
- 3 = Neither disagree nor agree
- 4 = Agree
- 5 = Strongly agree
To find the minimum and maximum, look for the lowest and highest values that appear in your data set. The minimum is 1, and the maximum is 5.
For the range, subtract the minimum from the maximum:
Range = 5 – 1 = 4
The range gives you a general idea of how widely your scores differ from each other. From this information, you can conclude there was at least one answer on either end of the scale.
Statistical tests
Inferential statistics help you test scientific hypotheses about your data. The most appropriate statistical tests for ordinal data focus on the rankings of your measurements. These are non-parametric tests.
Parametric tests are used when your data fulfils certain criteria, like a normal distribution. While parametric tests assess means, non-parametric tests often assess medians or ranks.
There are many possible statistical tests that you can use for ordinal data. Which one you choose depends on your aims and the number and type of samples.
| Non-parametric test | Aim | Samples or variables | Example |
|---|---|---|---|
| Mood’s median test | Compare the medians | 2 or more samples | How different are the median income levels of people in 2 neighbouring cities? |
| Mann-Whitney U test (Wilcoxon rank sum test) | Compare sum of rankings of scores | 2 independent samples | How does perceived social status in one city differ from that in another? |
| Wilcoxon matched-pairs signed-rank test | Compare magnitude and direction of difference between distributions of scores | 2 dependent samples | How similar are the distributions of income levels of Democrats and Republicans in the same city? |
| Kruskal–Wallis H test | Compare mean rankings of scores | 3 or more samples | How does perceived social status differ between Democrats, Republicans and Independents? |
| Spearman’s rho or rank correlation coefficient | Correlate 2 variables | 2 ordinal variables | Does income level correlate with perceived social status? |
Other interesting articles
If you want to know more about statistics, methodology, or research bias, make sure to check out some of our other articles with explanations and examples.
Statistics
Methodology
Frequently asked questions about ordinal data
Cite this Scribbr article
If you want to cite this source, you can copy and paste the citation or click the “Cite this Scribbr article” button to automatically add the citation to our free Citation Generator.
Bhandari, P. (2023, June 21). Ordinal Data | Definition, Examples, Data Collection & Analysis. Scribbr. Retrieved July 1, 2026, from https://www.scribbr.com/statistics/ordinal-data/
