Chi-Square (Χ²) Distributions | Definition & Examples
A chi-square (Χ2) distribution is a continuous probability distribution that is used in many hypothesis tests.
The shape of a chi-square distribution is determined by the parameter k. The graph below shows examples of chi-square distributions with different values of k.
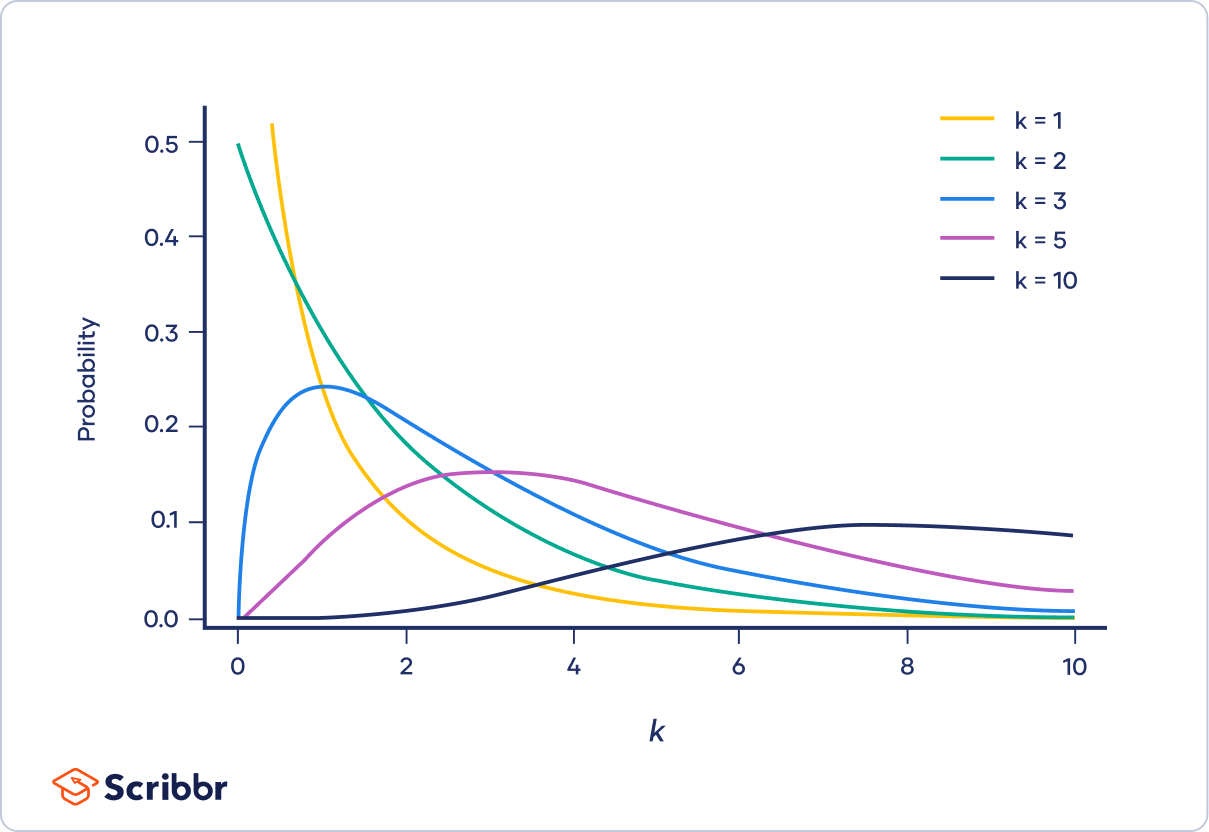
Table of contents
- What is a chi-square distribution?
- Chi-square test statistics (formula)
- The shape of chi-square distributions
- Properties of chi-square distributions
- Example applications of chi-square distributions
- The non-central chi-square distribution
- Other interesting articles
- Frequently asked questions about chi-square distributions
What is a chi-square distribution?
Chi-square (Χ2) distributions are a family of continuous probability distributions. They’re widely used in hypothesis tests, including the chi-square goodness of fit test and the chi-square test of independence.
The shape of a chi-square distribution is determined by the parameter k, which represents the degrees of freedom.
Very few real-world observations follow a chi-square distribution. The main purpose of chi-square distributions is hypothesis testing, not describing real-world distributions.
In contrast, most other widely used distributions, like normal distributions or Poisson distributions, can describe useful things such as newborns’ birth weights or disease cases per year, respectively.
Relationship to the standard normal distribution
Chi-square distributions are useful for hypothesis testing because of their close relationship to the standard normal distribution. The standard normal distribution, which is a normal distribution with a mean of zero and a variance of one, is central to many important statistical tests and theories.
Imagine taking a random sample of a standard normal distribution (Z). If you squared all the values in the sample, you would have the chi-square distribution with k = 1.
Χ21 = (Z)2
Now imagine taking samples from two standard normal distributions (Z1 and Z2). If each time you sampled a pair of values, you squared them and added them together, you would have the chi-square distribution with k = 2.
Χ22 = (Z1)2 + (Z2)2
More generally, if you sample from k independent standard normal distributions and then square and sum the values, you’ll produce a chi-square distribution with k degrees of freedom.
Χ2k = (Z1)2 + (Z2)2 + … + (Zk)2

Chi-square test statistics (formula)
Chi-square tests are hypothesis tests with test statistics that follow a chi-square distribution under the null hypothesis. Pearson’s chi-square test was the first chi-square test to be discovered and is the most widely used.
Pearson’s chi-square test statistic is:
| Formula | Explanation |
|---|---|
 |
Where
|
 is the summation operator (it means “take the sum of”)
 is the observed frequency
 is the expected frequency
If you sample a population many times and calculate Pearson’s chi-square test statistic for each sample, the test statistic will follow a chi-square distribution if the null hypothesis is true.
The shape of chi-square distributions
We can see how the shape of a chi-square distribution changes as the degrees of freedom (k) increase by looking at graphs of the chi-square probability density function. A probability density function is a function that describes a continuous probability distribution.
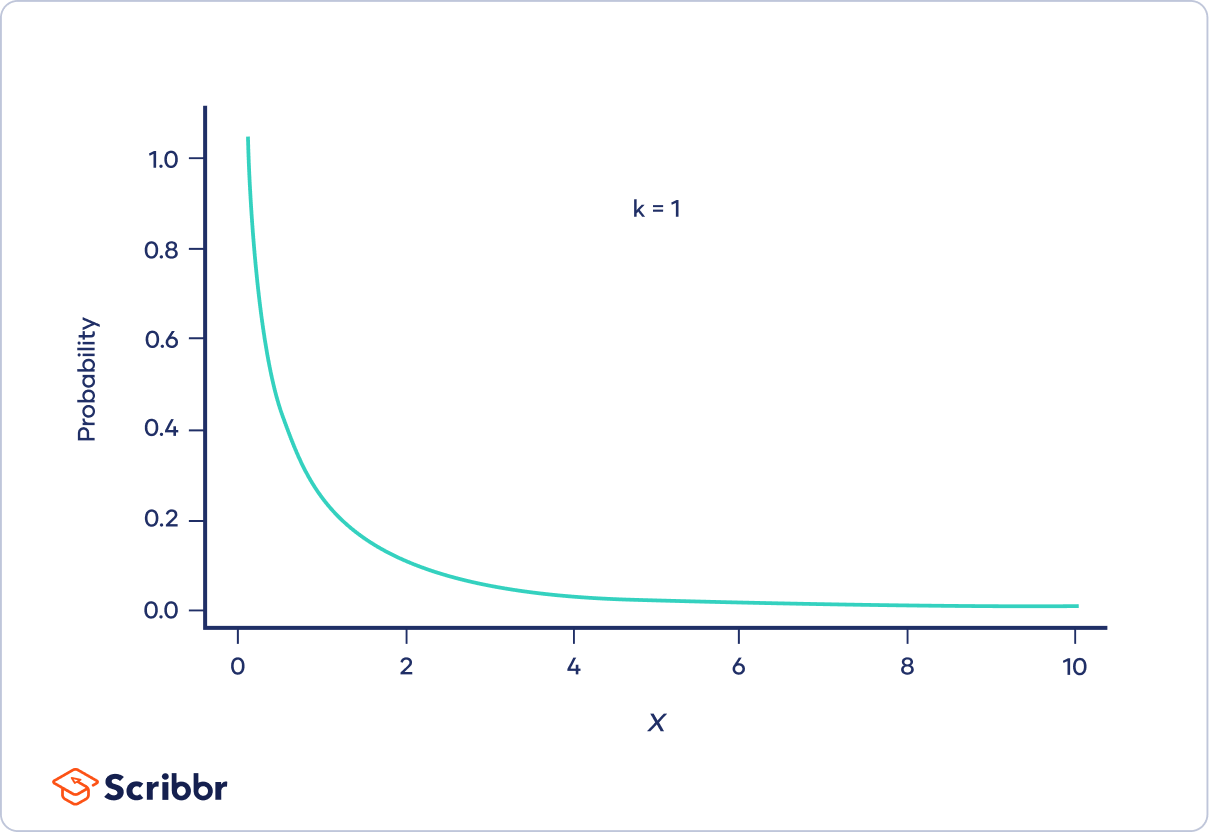
When k is one or two
When k is one or two, the chi-square distribution is a curve shaped like a backwards “J.” The curve starts out high and then drops off, meaning that there is a high probability that Χ² is close to zero.
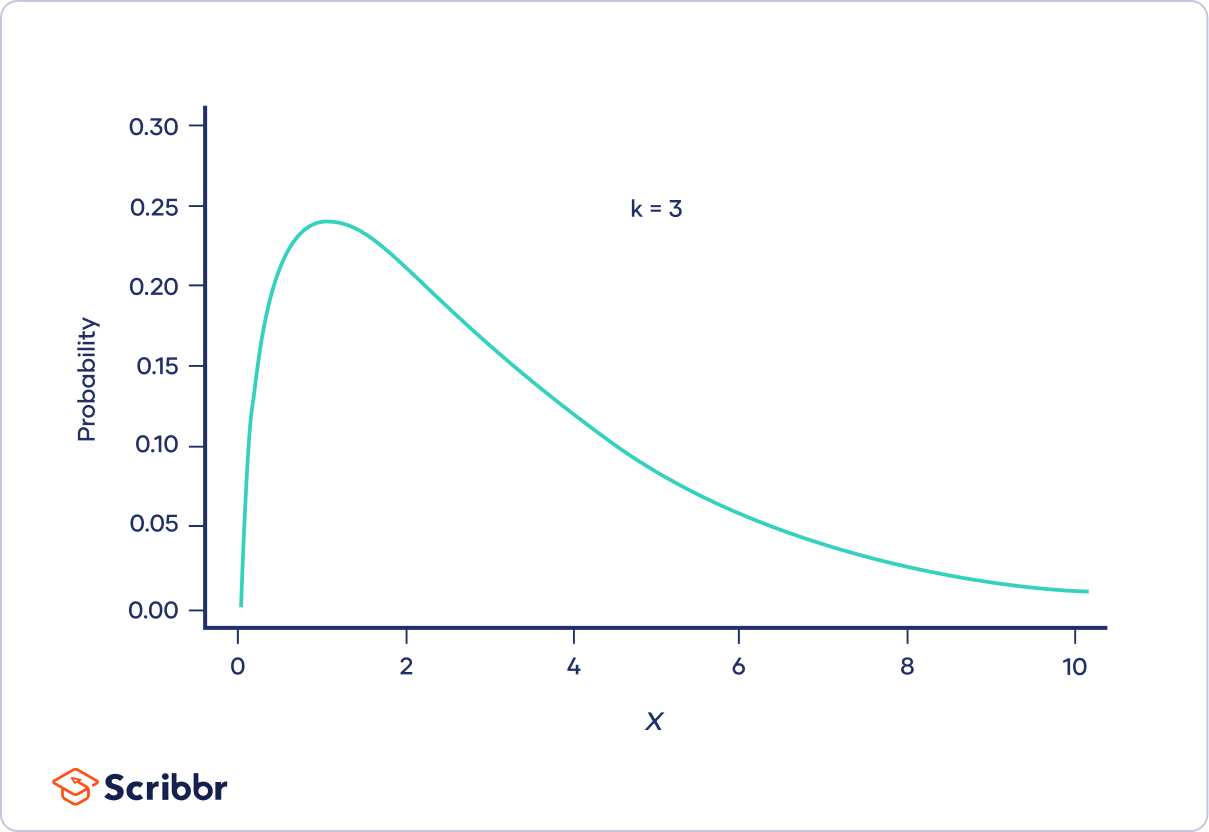
When k is greater than two
When k is greater than two, the chi-square distribution is hump-shaped. The curve starts out low, increases, and then decreases again. There is low probability that Χ² is very close to or very far from zero. The most probable value of Χ² is Χ² − 2.
When k is only a bit greater than two, the distribution is much longer on the right side of its peak than its left (i.e., it is strongly right-skewed).
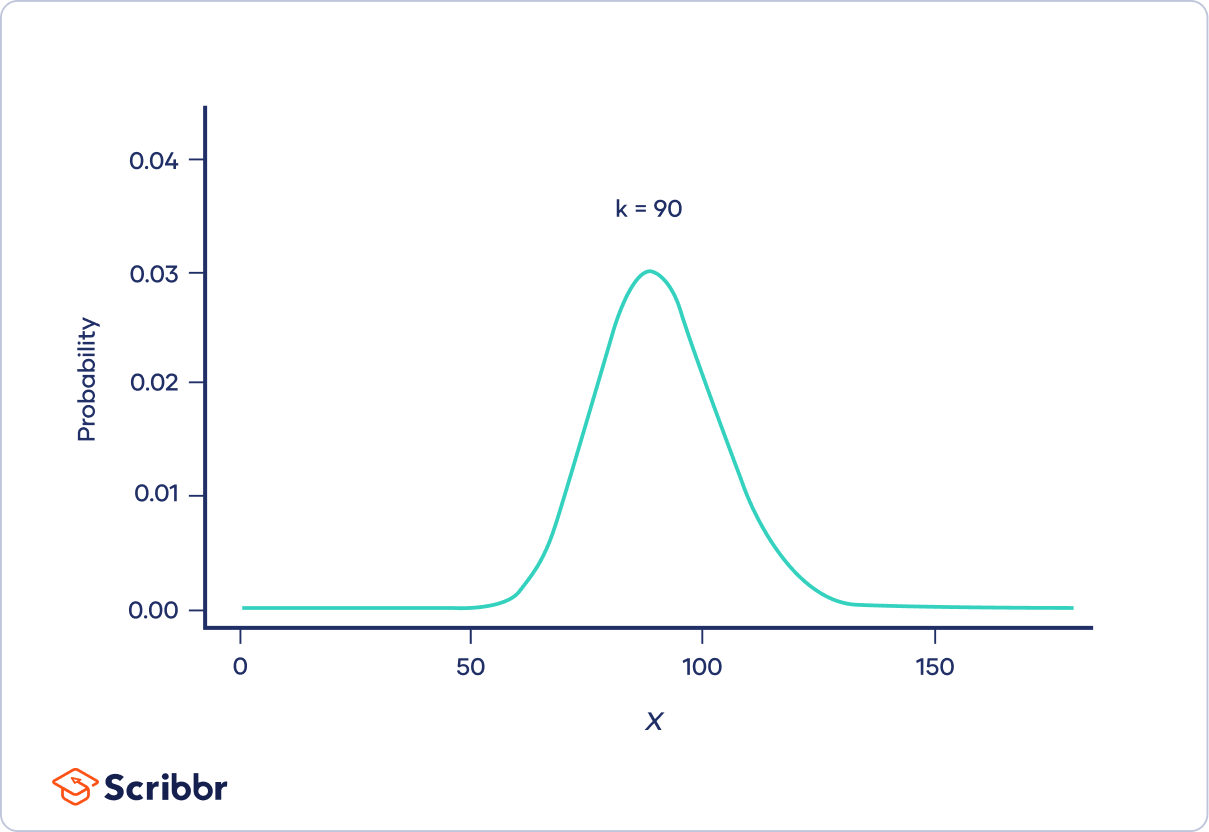
As k increases, the distribution looks more and more similar to a normal distribution. In fact, when k is 90 or greater, a normal distribution is a good approximation of the chi-square distribution.
Properties of chi-square distributions
Chi-square distributions start at zero and continue to infinity. The chi-square distribution starts at zero because it describes the sum of squared random variables, and a squared number can’t be negative.
The mean (μ) of the chi-square distribution is its degrees of freedom, k. Because the chi-square distribution is right-skewed, the mean is greater than the median and mode. The variance of the chi-square distribution is 2k.
| Property | Value |
|---|---|
| Continuous or discrete | Continuous |
| Mean | k |
| Mode | k − 2 (when k > 2) |
| Variance | 2k |
| Standard deviation |  |
| Range | 0 to ∞ |
| Symmetry | Asymmetrical (right-skewed), but increasingly symmetrical as k increases. |
Example applications of chi-square distributions
The chi-square distribution makes an appearance in many statistical tests and theories. The following are a few of the most common applications of the chi-square distribution.
Pearson’s chi-square test
One of the most common applications of chi-square distributions is Pearson’s chi-square tests. Pearson’s chi-square tests are statistical tests for categorical data. They’re used to determine whether your data are significantly different from what you expected. There are two types of Pearson’s chi-square tests:
| Color | Frequency |
|---|---|
| Red | 30 |
| Gray | 29 |
| Yellow | 26 |
| Pink | 33 |
| Black | 56 |
| White | 90 |
| Blue | 86 |
Since there were 350 shirt sales in total, 50 sales per color would be exactly equal. It’s obvious that there weren’t exactly 50 sales per color. However, this is just a one-week sample, so we should expect the numbers to be a little unequal just due to chance.
Does the sample give enough evidence to conclude that the frequency of shirt sales truly differs between shirt colors?
A chi-square goodness of fit test can test whether the observed frequencies are significantly different from equal frequencies. By comparing Pearson’s chi-square test statistic to the appropriate chi-square distribution, the company can calculate the probability of these shirt sale values (or more extreme values) happening due to chance.
Population variance inferences
The chi-square distribution can also be used to make inferences about a population’s variance (σ²) or standard deviation (σ). Using the chi-square distribution, you can test the hypothesis that a population variance is equal to a certain value using the test of a single variance or calculate confidence intervals for a population’s variance.
To test whether they’ve achieved their goal, the union randomly selects 30 workers with the same seniority. It finds that the standard deviation of the sample is $1.98. This is very slightly less than $2, but it’s just a sample. Is it enough evidence to conclude that the true standard deviation of all workers with the same seniority is less than $2?
The union can use the test of a single variance to find out whether the standard deviation (σ) is significantly different from $2.
- Null hypothesis (H0): σ2 ≥ 22
- Alternative hypothesis (Ha): σ2 < 22
By comparing a chi-square test statistic to the appropriate chi-square distribution, the union can decide whether to reject the null hypothesis.
F distribution definition
Chi-square distributions are important in defining the F distribution, which is used in ANOVAs.
Imagine you take random samples from a chi-square distribution, and then divide the sample by the k of the distribution. Next, you repeat the process with a different chi-square distribution. If you take the ratios of the values from the two distributions, you will have an F distribution.
The non-central chi-square distribution
The non-central chi-square distribution is a more general version of the chi-square distribution. It’s used in some types of power analyses.
The non-central chi-square distribution has an extra parameter called λ (lambda) or the non-central parameter. This parameter changes the shape of the distribution, shifting the peak to the right and increasing the variance as λ increases.
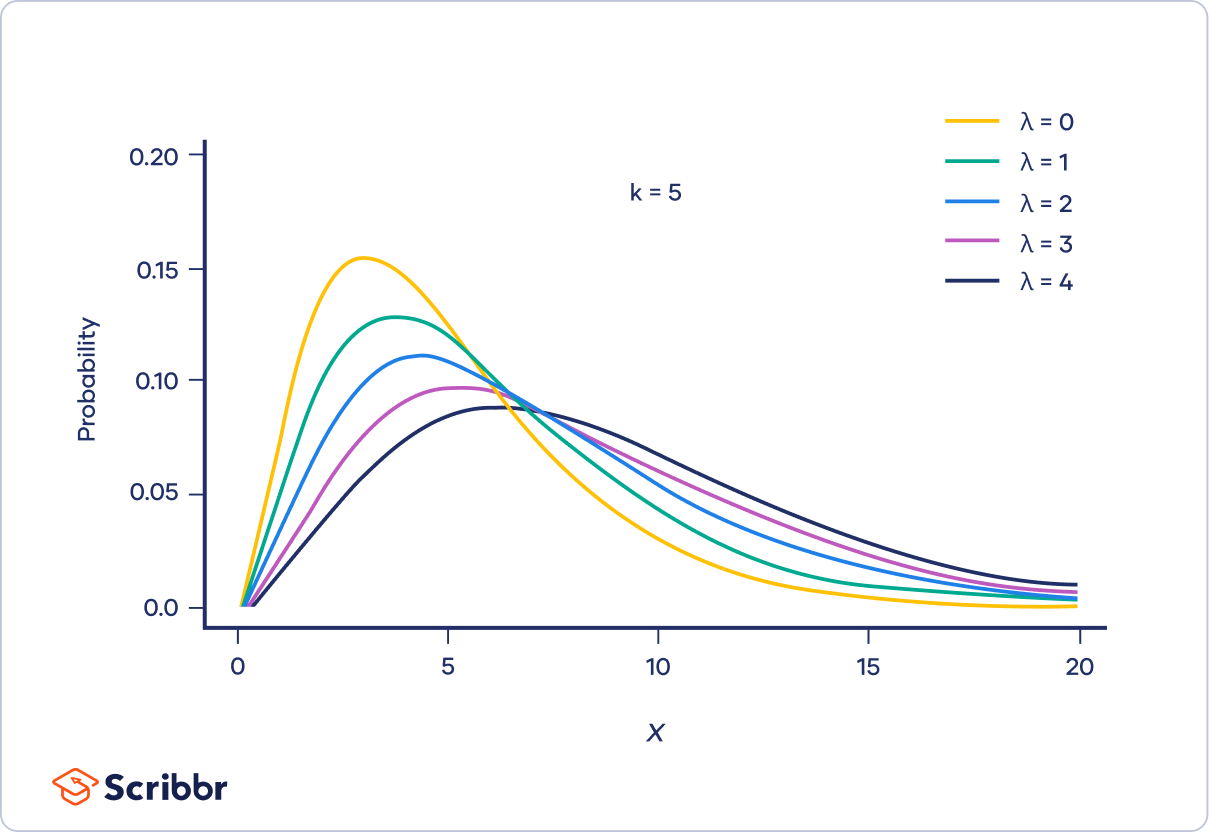
The λ parameter works by defining the mean of the normal distributions that underlie the chi-square distribution. For example, you can produce a non-central chi-square distribution with λ = 2 and k = 3 by squaring and summing values sampled from three normal distributions, each with a mean of two and a variance of one.
Other interesting articles
If you want to know more about statistics, methodology, or research bias, make sure to check out some of our other articles with explanations and examples.
Statistics
Methodology
Frequently asked questions about chi-square distributions
Cite this Scribbr article
If you want to cite this source, you can copy and paste the citation or click the “Cite this Scribbr article” button to automatically add the citation to our free Citation Generator.
Turney, S. (2023, June 21). Chi-Square (Χ²) Distributions | Definition & Examples. Scribbr. Retrieved July 1, 2026, from https://www.scribbr.com/statistics/chi-square-distributions/