Published on
July 7, 2022
by
Shaun Turney.
Revised on
June 22, 2023.
Degrees of freedom, often represented by v or df, is the number of independent pieces of information used to calculate a statistic. It’s calculated as the sample size minus the number of restrictions.
Degrees of freedom are normally reported in brackets beside the test statistic, alongside the results of the statistical test.
Example: Degrees of freedomSuppose you randomly sample 10 American adults and measure their daily calcium intake. You use a one-sample t test to determine whether the mean daily intake of American adults is equal to the recommended amount of 1000 mg.
The test statistic, t, has 9 degrees of freedom:
df = n − 1
df = 10 − 1
df = 9
You calculate a t value of 1.41 for the sample, which corresponds to a p value of .19. You report your results:
“The participants’ mean daily calcium intake did not differ from the recommended amount of 1000 mg, t(9) = 1.41, p = 0.19.”
Published on
July 6, 2022
by
Shaun Turney.
Revised on
February 25, 2026.
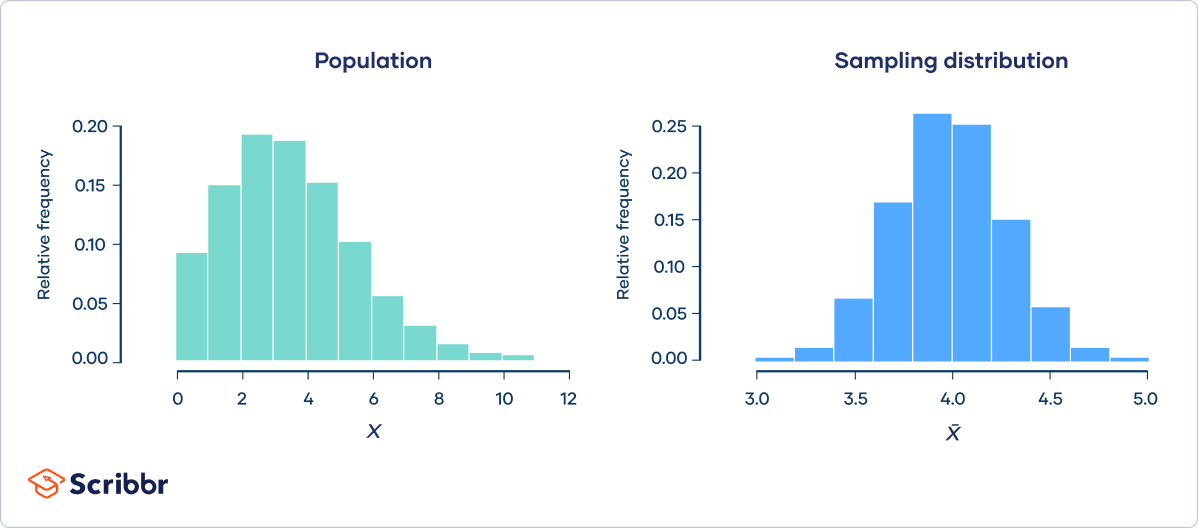
The central limit theorem states that if you take sufficiently large samples from a population, the samples’ means will be normally distributed , even if the population isn’t normally distributed.
Example: Central limit theoremA population follows a Poisson distribution (left image). If we take 10,000 samples from the population, each with a sample size of 50, the sample means follow a normal distribution, as predicted by the central limit theorem (right image).
Published on
June 27, 2022
by
Shaun Turney.
Revised on
January 29, 2024.
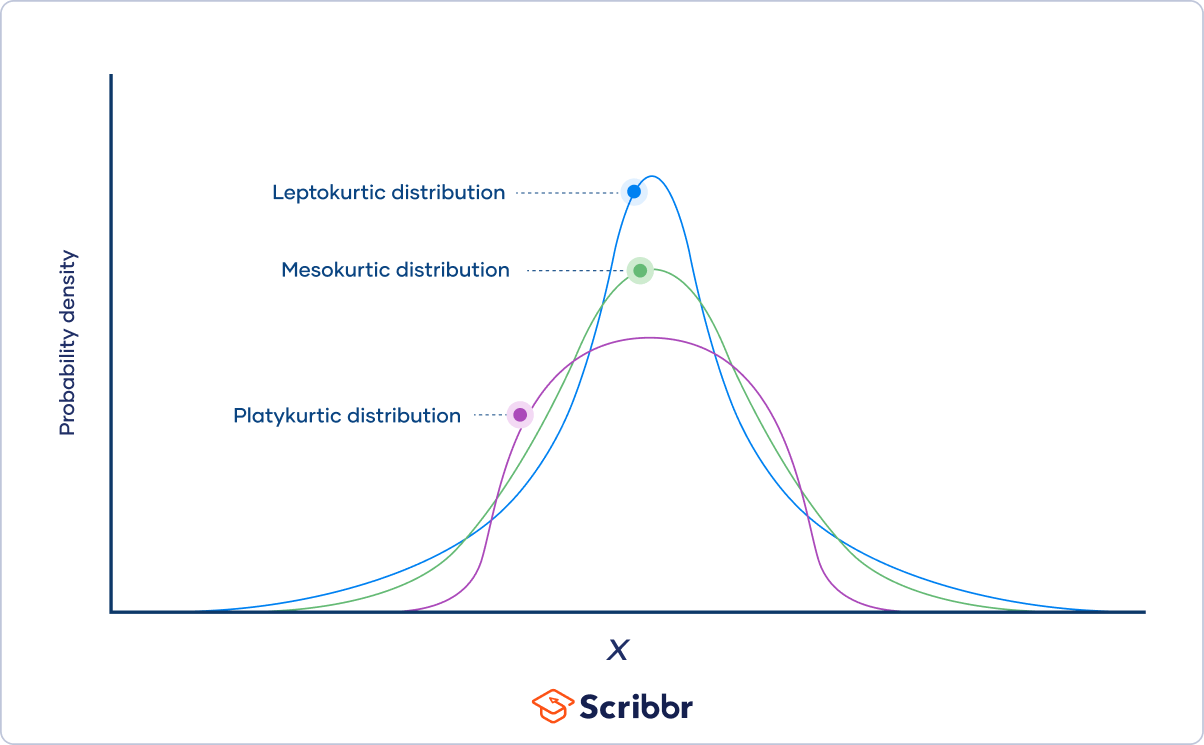
Kurtosis is a measure of the tailedness of a distribution. Tailedness is how often outliers occur. Excess kurtosis is the tailedness of a distribution relative to a normal distribution.
Distributions with medium kurtosis (medium tails) are mesokurtic.
Distributions with low kurtosis (thin tails) are platykurtic.
Distributions with high kurtosis (fat tails) are leptokurtic.
Tails are the tapering ends on either side of a distribution. They represent the probability or frequency of values that are extremely high or low compared to the mean. In other words, tails represent how often outliers occur.
Published on
June 15, 2022
by
Shaun Turney.
Revised on
November 20, 2023.
A systematic review is a type of review that uses repeatable methods to find, select, and synthesize all available evidence. It answers a clearly formulated research question and explicitly states the methods used to arrive at the answer.
Example: Systematic reviewIn 2008, Dr. Robert Boyle and his colleagues published a systematic review in the Cochrane Database of Systematic Reviews.
They answered the question “What is the effectiveness of probiotics in reducing eczema symptoms and improving quality of life in patients with eczema?”
In this context, a probiotic is a health product that contains live microorganisms and is taken by mouth. Eczema is a common skin condition that causes red, itchy skin.
They used systematic methods to find, select, and synthesize all available evidence, and they described these methods in detail in their article. Based on the evidence, Boyle and colleagues concluded that probiotics cannot be recommended for reducing eczema symptoms or improving quality of life in patients with eczema.
Published on
June 9, 2022
by
Shaun Turney.
Revised on
January 24, 2025.
A probability distribution is a mathematical function that describes the probability of different possible values of a variable. Probability distributions are often depicted using graphs or probability tables.
Example: Probability distributionWe can describe the probability distribution of one coin flip using a probability table:
Published on
June 7, 2022
by
Shaun Turney.
Revised on
June 21, 2023.
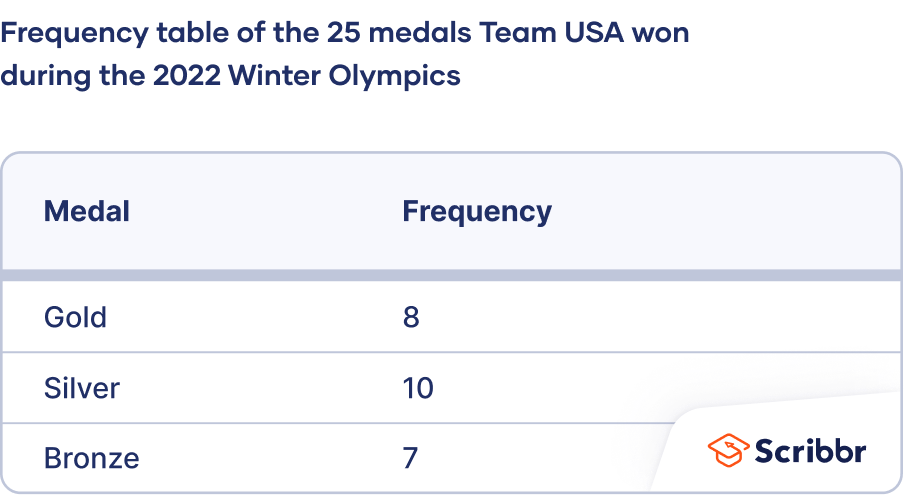
A frequency distribution describes the number of observations for each possible value of a variable. Frequency distributions are depicted using graphs and frequency tables.
Example: Frequency distributionIn the 2022 Winter Olympics, Team USA won 25 medals. This frequency table gives the medals’ values (gold, silver, and bronze) and frequencies:
Published on
May 31, 2022
by
Shaun Turney.
Revised on
June 21, 2023.
The chi-square (Χ2) distribution table is a reference table that lists chi-square critical values. A chi-square critical value is a threshold for statistical significance for certain hypothesis tests and defines confidence intervals for certain parameters.
Chi-square critical values are calculated from chi-square distributions. They’re difficult to calculate by hand, which is why most people use a reference table or statistical software instead.
Example: Chi-square test of independenceImagine a city wants to encourage more of its residents to recycle their household waste.
The city decides to test two interventions: an educational flyer (pamphlet) or a phone call. They randomly select 300 households and randomly assign them to the flyer, phone call, or control group (no intervention). They’ll use the results of their experiment to decide which intervention to use for the whole city.
The city plans to use a chi-square test of independence to test whether the proportion of households who recycle differs between the interventions.
Published on
May 24, 2022
by
Shaun Turney.
Revised on
June 22, 2023.
A chi-square (Χ2) goodness of fit test is a type of Pearson’s chi-square test. You can use it to test whether the observed distribution of a categorical variable differs from your expectations.
Example: Chi-square goodness of fit testYou’re hired by a dog food company to help them test three new dog food flavors.
You recruit a random sample of 75 dogs and offer each dog a choice between the three flavors by placing bowls in front of them. You expect that the flavors will be equally popular among the dogs, with about 25 dogs choosing each flavor.
Once you have your experimental results, you plan to use a chi-square goodness of fit test to figure out whether the distribution of the dogs’ flavor choices is significantly different from your expectations.
The chi-square goodness of fit test tells you how well a statistical model fits a set of observations. It’s often used to analyze genetic crosses.
Published on
May 23, 2022
by
Shaun Turney.
Revised on
June 22, 2023.
A Pearson’s chi-square test is a statistical test for categorical data. It is used to determine whether your data are significantly different from what you expected. There are two types of Pearson’s chi-square tests:
The chi-square goodness of fit test is used to test whether the frequency distribution of a categorical variable is different from your expectations.