Published on
May 20, 2022
by
Shaun Turney.
Revised on
June 21, 2023.
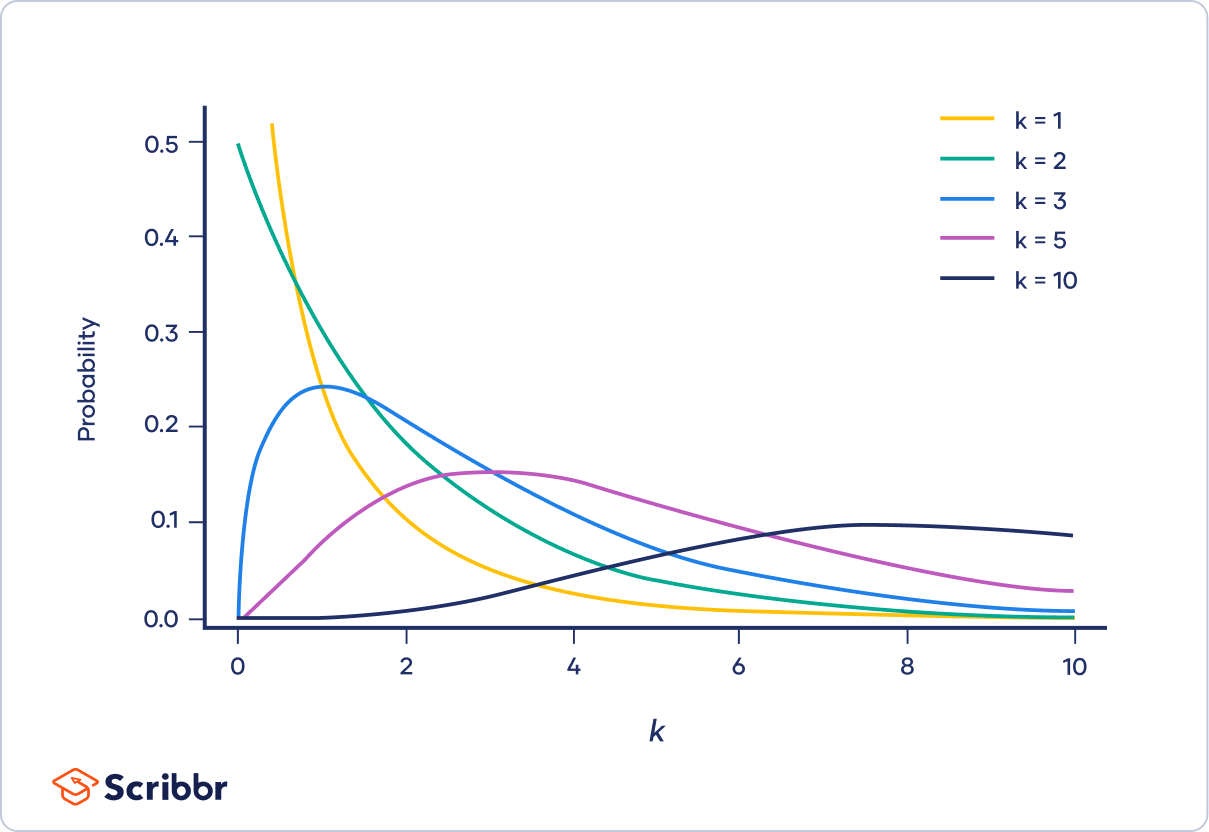
A chi-square (Χ2) distribution is a continuous probability distribution that is used in many hypothesis tests.
The shape of a chi-square distribution is determined by the parameter k. The graph below shows examples of chi-square distributions with different values of k.
Published on
May 13, 2022
by
Shaun Turney.
Revised on
February 10, 2024.
The Pearson correlation coefficient (r) is the most common way of measuring a linear correlation. It is a number between –1 and 1 that measures the strength and direction of the relationship between two variables.
Pearson correlation coefficient (r)
Correlation type
Interpretation
Example
Between 0 and 1
Positive correlation
When one variable changes, the other variable changes in the same direction.
Baby length & weight:
The longer the baby, the heavier their weight.
0
No correlation
There is no relationship between the variables.
Car price & width of windshield wipers:
The price of a car is not related to the width of its windshield wipers.
Between
0 and –1
Negative correlation
When one variable changes, the other variable changes in the opposite direction.
Elevation & air pressure:
The higher the elevation, the lower the air pressure.
Published on
May 13, 2022
by
Shaun Turney.
Revised on
June 21, 2023.
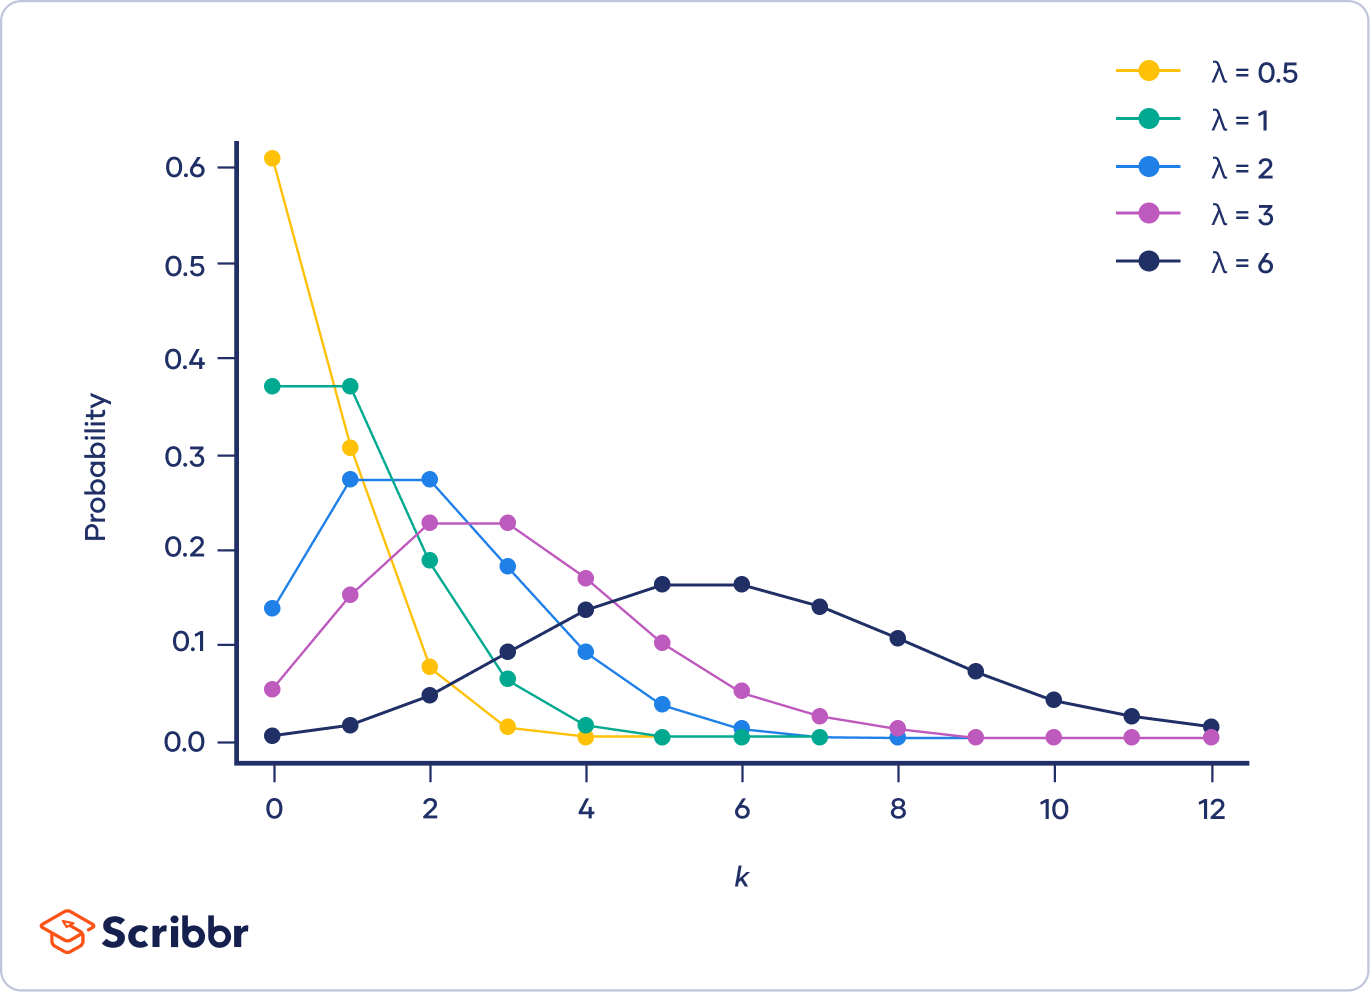
A Poisson distribution is a discrete probability distribution. It gives the probability of an event happening a certain number of times (k) within a given interval of time or space.
The Poisson distribution has only one parameter, λ (lambda), which is the mean number of events. The graph below shows examples of Poisson distributions with different values of λ.
Published on
May 10, 2022
by
Shaun Turney.
Revised on
November 10, 2023.
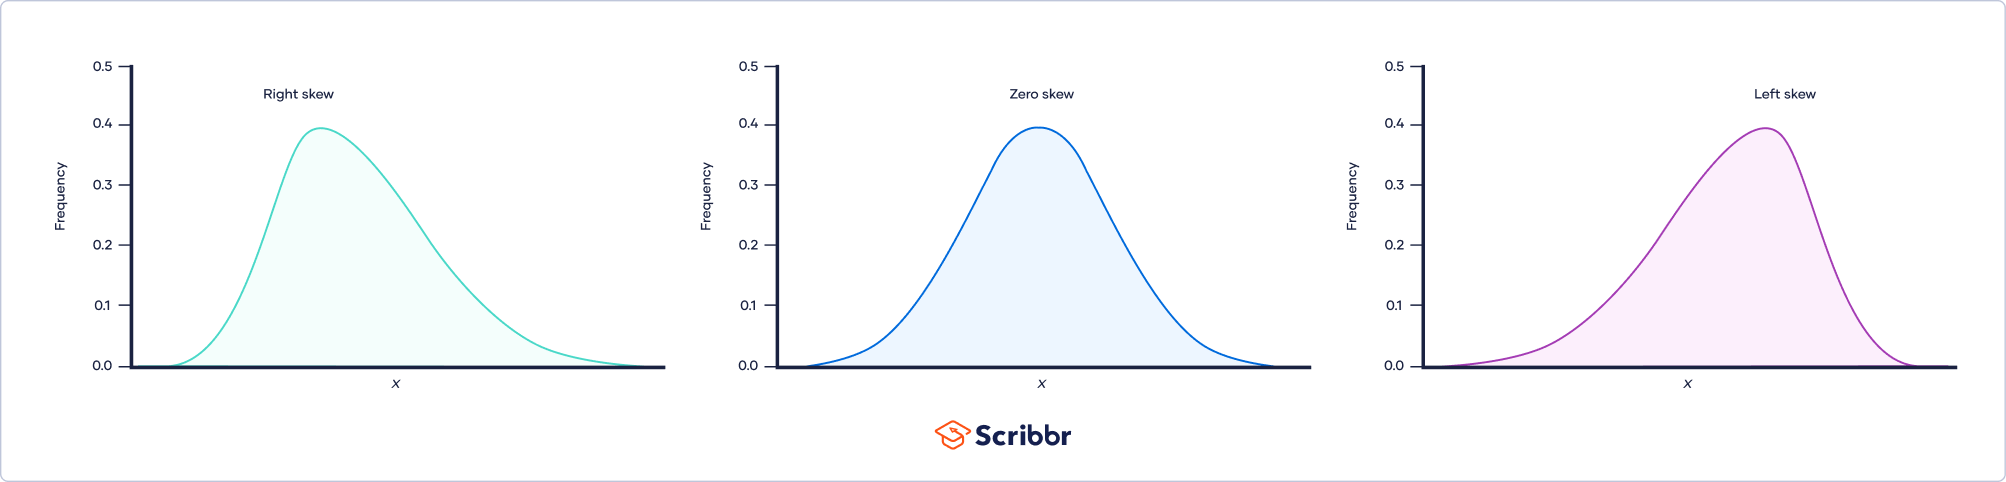
Skewness is a measure of the asymmetry of a distribution. A distribution is asymmetrical when its left and right side are not mirror images.
A distribution can have right (or positive), left (or negative), or zero skewness. A right-skewed distribution is longer on the right side of its peak, and a left-skewed distribution is longer on the left side of its peak:
You might want to calculate the skewness of a distribution to:
Published on
April 29, 2022
by
Shaun Turney.
Revised on
June 21, 2023.
Student’s t table is a reference table that lists critical values of t. Student’s t table is also known as the t table, t-distribution table, t-score table, t-value table, or t-test table.
A critical value of t defines the threshold for significance for certain statistical tests and the upper and lower bounds of confidence intervals for certain estimates. It is most commonly used when:
Testing whether two means are significantly different (two-sample t tests)
The critical values of t are calculated from Student’s t distribution. Student’s t distribution is the distribution of the test statistict. The critical values of t are difficult to calculate by hand, which is why most people use a t table or computer software instead.
Published on
April 22, 2022
by
Shaun Turney.
Revised on
June 22, 2023.
The coefficient of determination is a number between 0 and 1 that measures how well a statistical model predicts an outcome.
Interpreting the coefficient of determination
Coefficient of determination (R2)
Interpretation
0
The model does not predict the outcome.
Between 0 and 1
The model partially predicts the outcome.
1
The model perfectly predicts the outcome.
The coefficient of determination is often written as R2, which is pronounced as “r squared.” For simple linear regressions, a lowercase r is usually used instead (r2).