Parameter vs Statistic | Definitions, Differences & Examples
A parameter is a number describing a whole population (e.g., population mean), while a statistic is a number describing a sample (e.g., sample mean).
The goal of quantitative research is to understand characteristics of populations by finding parameters. In practice, it’s often too difficult, time-consuming or unfeasible to collect data from every member of a population. Instead, data is collected from samples.
With inferential statistics, we can use sample statistics to make educated guesses about population parameters.
Population vs sample
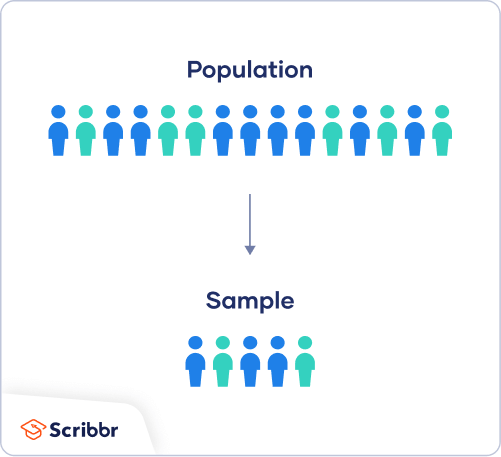 In research, a population is the entire group that you’re interested in studying. This may be a group of people (e.g., all adults in the US or all employees of a company), but it can also mean a group containing other kinds of elements: objects, events, organizations, countries, species, organisms, etc.
A sample is a smaller group taken from the population. The sample is the group of elements that you will actually collect data from.
What kinds of numbers are parameters and statistics?
Statistics and parameters are numbers that summarize any measurable characteristic of a sample or a population.
For categorical variables (e.g., political affiliation), the most common statistic or parameter is a proportion.
For numerical variables (e.g., height), the mean or standard deviation are commonly reported statistics or parameters.
| Sample statistic | Population parameter |
|---|---|
| Proportion of 2000 randomly sampled participants that support the death penalty. | Proportion of all US residents that support the death penalty. |
| Median income of 850 college students in Boston and Wellesley. | Median income of all college students in Massachusetts. |
| Standard deviation of weights of avocados from one farm. | Standard deviation of weights of all avocados in the region. |
| Mean screen time of 3000 high school students in India. | Mean screen time of all high school students in India. |
Statistical notation
Different symbols are used for statistics versus parameters to show whether a sample or a population is being referred to.
Greek letters and capital letters usually refer to populations, whereas Latin letters and lower-case letters refer to samples.
| Sample statistic | Population parameter | |
|---|---|---|
| Proportion | p̂ (called “p-hat”) | P |
| Mean | x̄ (called “x-bar”) | μ (Greek letter “mu”) |
| Standard deviation | s (Latin letter “s”) | σ (Greek letter “sigma”) |
| Variance | s2 | σ2 |
Telling the difference between a parameter and a statistic
In news and research reports, it’s not always clear whether a number is a parameter or statistic. To figure out which type of number you’re dealing with, ask yourself the following:
- Does the number describe a whole, complete population where every member can be reached for data collection?
- Is it possible to collect data on this characteristic from every member of the population in a reasonable time frame?
If the answer is yes to both questions, the number is likely to be a parameter. For small populations, data can be collected from the whole population and summarized in parameters.
If the answer is no to either of the questions, then the number is more likely to be a statistic. Sampling is used to collect data from large populations and generalize the statistics to the broader population in an externally valid way.
Quiz: Statistic or parameter?
Estimating parameters from statistics
Using inferential statistics, you can estimate population parameters from sample statistics. To make unbiased estimates, your sample should ideally be representative of your population and/or randomly selected.
There are two important types of estimates you can make about the population parameter: point estimates and interval estimates.
- A point estimate is a single value estimate of a parameter based on a statistic. For instance, a sample mean is a point estimate of a population mean.
- An interval estimate gives you a range of values where the parameter is expected to lie. A confidence interval is the most common type of interval estimate.
Both types of estimates are important for gathering a clear idea of where a parameter is likely to lie.
Your point estimate is your sample statistic – you estimate that 61% of all US residents support the death penalty.
To find the interval estimate, you construct a 95% confidence interval that tells you where the population parameter is expected to lie most of the time. With random sampling, there is a 0.95 probability that the true population parameter for support for the death penalty among US residents lies between 57% and 65%.

Other interesting articles
If you want to know more about statistics, methodology, or research bias, make sure to check out some of our other articles with explanations and examples.
Statistics
Methodology
Frequently asked questions about parameters and statistics
Cite this Scribbr article
If you want to cite this source, you can copy and paste the citation or click the “Cite this Scribbr article” button to automatically add the citation to our free Citation Generator.
Bhandari, P. (2023, June 22). Parameter vs Statistic | Definitions, Differences & Examples. Scribbr. Retrieved July 9, 2026, from https://www.scribbr.com/statistics/parameter-vs-statistic/
