What Is Kurtosis? | Definition, Examples & Formula
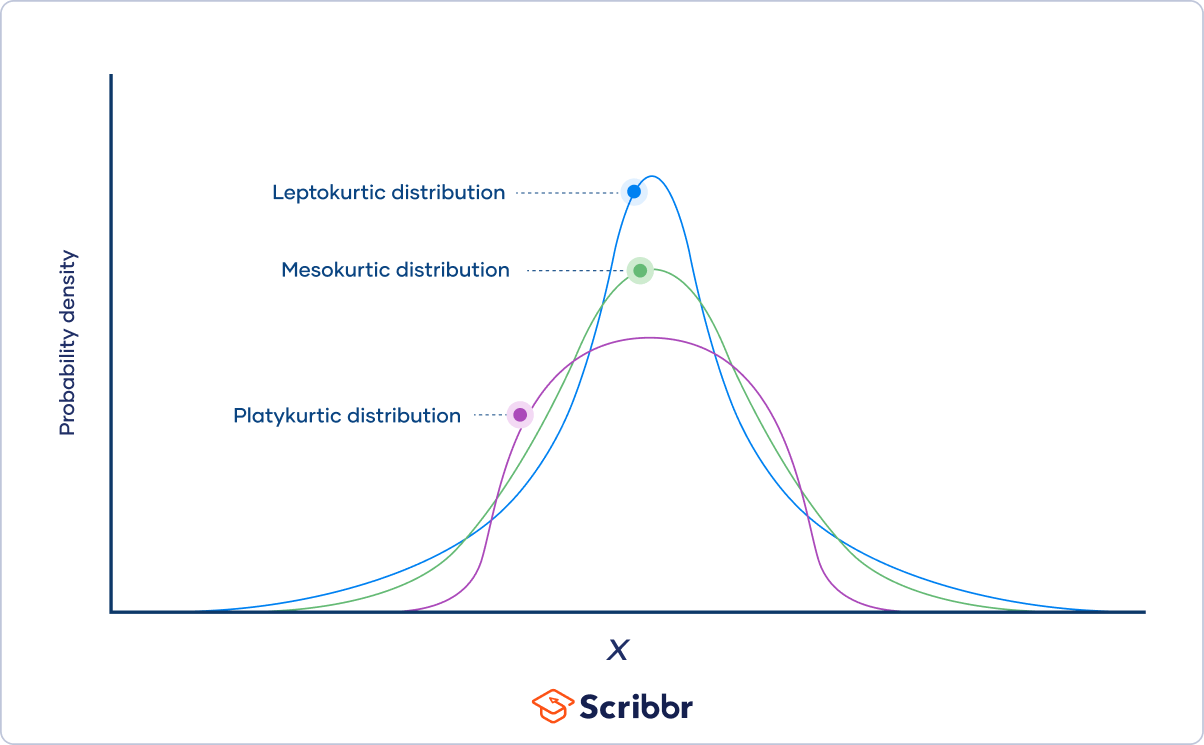
Kurtosis is a measure of the tailedness of a distribution. Tailedness is how often outliers occur. Excess kurtosis is the tailedness of a distribution relative to a normal distribution.
- Distributions with medium kurtosis (medium tails) are mesokurtic.
- Distributions with low kurtosis (thin tails) are platykurtic.
- Distributions with high kurtosis (fat tails) are leptokurtic.
Tails are the tapering ends on either side of a distribution. They represent the probability or frequency of values that are extremely high or low compared to the mean. In other words, tails represent how often outliers occur.
Example: Types of kurtosis
Types of kurtosis
Distributions can be categorized into three groups based on their kurtosis:
| Category | |||
|---|---|---|---|
| Mesokurtic | Platykurtic | Leptokurtic | |
| Tailedness | Medium-tailed | Thin-tailed | Fat-tailed |
| Outlier frequency | Medium | Low | High |
| Kurtosis | Moderate (3) | Low (< 3) | High (> 3) |
| Excess kurtosis | 0 | Negative | Positive |
| Example distribution | Normal | Uniform | Laplace |

What is a mesokurtic distribution?
A mesokurtic distribution is medium-tailed, so outliers are neither highly frequent, nor highly infrequent.
Kurtosis is measured in comparison to normal distributions.
- Normal distributions have a kurtosis of 3, so any distribution with a kurtosis of approximately 3 is mesokurtic.
Often, kurtosis is described in terms of excess kurtosis, which is kurtosis − 3. Since normal distributions have a kurtosis of 3, excess kurtosis makes comparing a distribution’s kurtosis to a normal distribution even easier:
- Normal distributions have an excess kurtosis of 0, so any distribution with an excess kurtosis of approximately 0 is mesokurtic.
Mesokurtic distribution example
On average, a female baby elephant weighs an impressive 210 lbs at birth. Suppose that a zoologist is interested in the distribution of elephant birth weights, so she contacts zoos and sanctuaries around the world and asks them to share their data. She collects birth weight data for 400 female baby elephants:
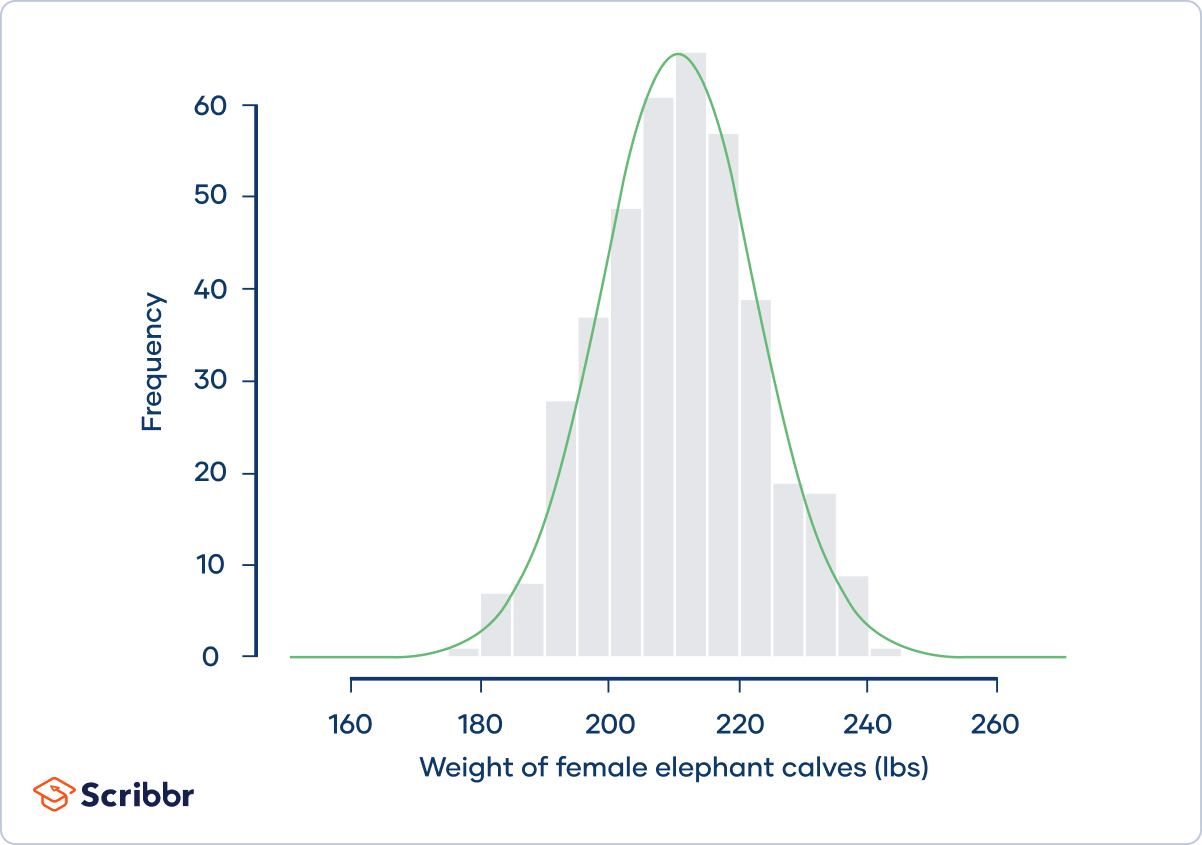
From the graph, we can see that the frequency distribution (shown by the gray bars) approximately follows a normal distribution (shown by the green curve). Normal distributions are mesokurtic.
The zoologist calculates the kurtosis of the sample. She finds that the kurtosis is 3.09 and the excess kurtosis is 0.09, and she concludes that the distribution is mesokurtic.
Mesokurtic distributions have outliers that are neither highly frequent, nor highly infrequent, and this is true of the elephant birth weights. Occasionally, a female baby elephant will be born weighing less than 180 or more than 240 lbs.
What is a platykurtic distribution?
A platykurtic distribution is thin-tailed, meaning that outliers are infrequent.
Platykurtic distributions have less kurtosis than a normal distribution. In other words, platykurtic distributions have:
- A kurtosis of less than 3
- An excess kurtosis of less than 0
Platykurtosis is sometimes called negative kurtosis, since the excess kurtosis is negative.
A trick to remember the meaning of “platykurtic” is to think of a platypus with a thin tail.
Platykurtic distribution example
A sociologist is studying the social media use of students at a small high school. There are 400 students at the school, ranging in age from 14 to 18 years old:
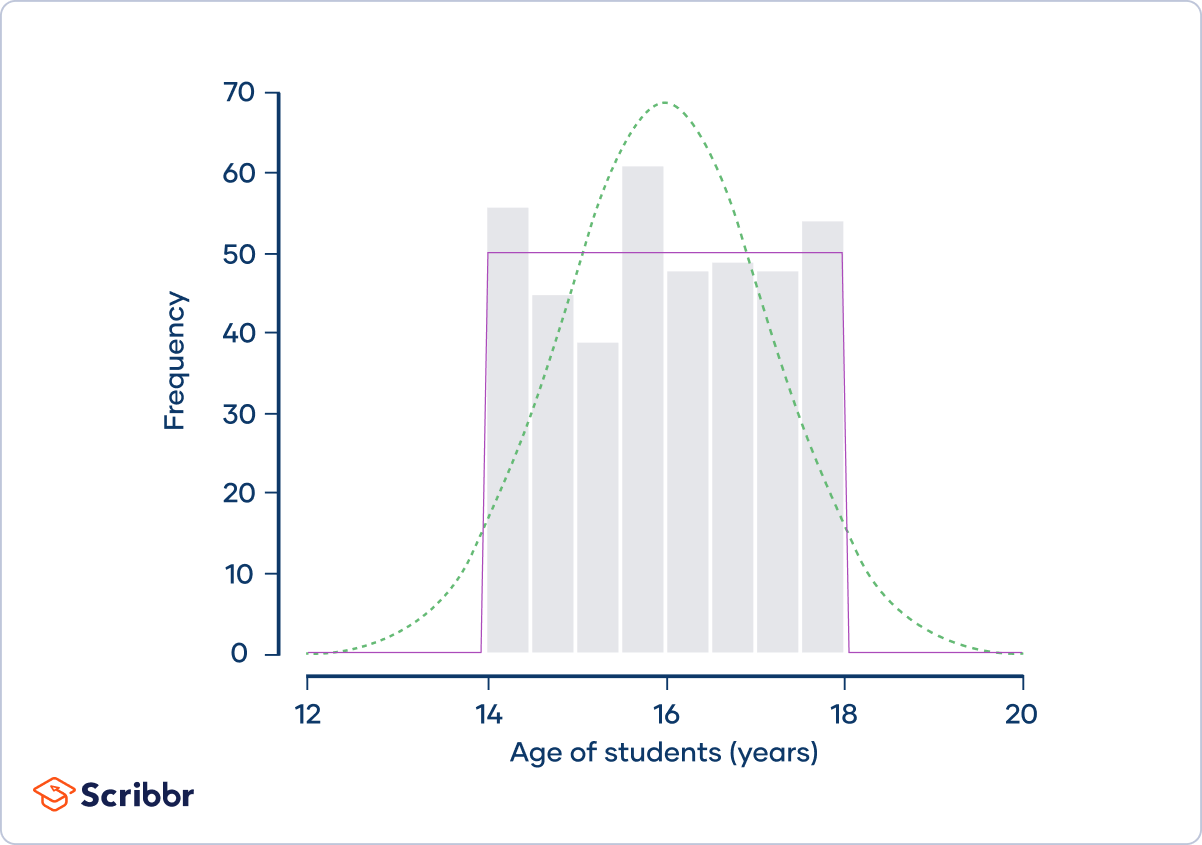
The frequency distribution (shown by the gray bars) doesn’t follow a normal distribution (shown by the dotted green curve). Instead, it approximately follows a uniform distribution (shown by the purple curve). Uniform distributions are platykurtic.
The sociologist calculates that the kurtosis of the sample is 1.78 and its excess kurtosis is −1.22. He concludes that the distribution is platykurtic.
Platykurtic distributions have a low frequency of outliers. Uniform distributions, like the distribution of students’ ages, are the extreme cases of platykurtic distributions because outliers are so rare that they’re completely absent. There are no students younger than 14 or older than 18 years.
What is a leptokurtic distribution?
A leptokurtic distribution is fat-tailed, meaning that there are a lot of outliers.
Leptokurtic distributions are more kurtotic than a normal distribution. They have:
- A kurtosis of more than 3
- An excess kurtosis of more than 0
Leptokurtosis is sometimes called positive kurtosis, since the excess kurtosis is positive.
A trick to remember the meaning of “leptokurtic” is to think of a leaping kangaroo with a fat tail.
Leptokurtic distribution example
Imagine that four astronomers are all trying to measure the distance between the Earth and Nu2 Draconis A, a blue star that’s part of the Draco constellation. Each of the four astronomers measures the distance 100 times, and they put their data together in the same dataset:
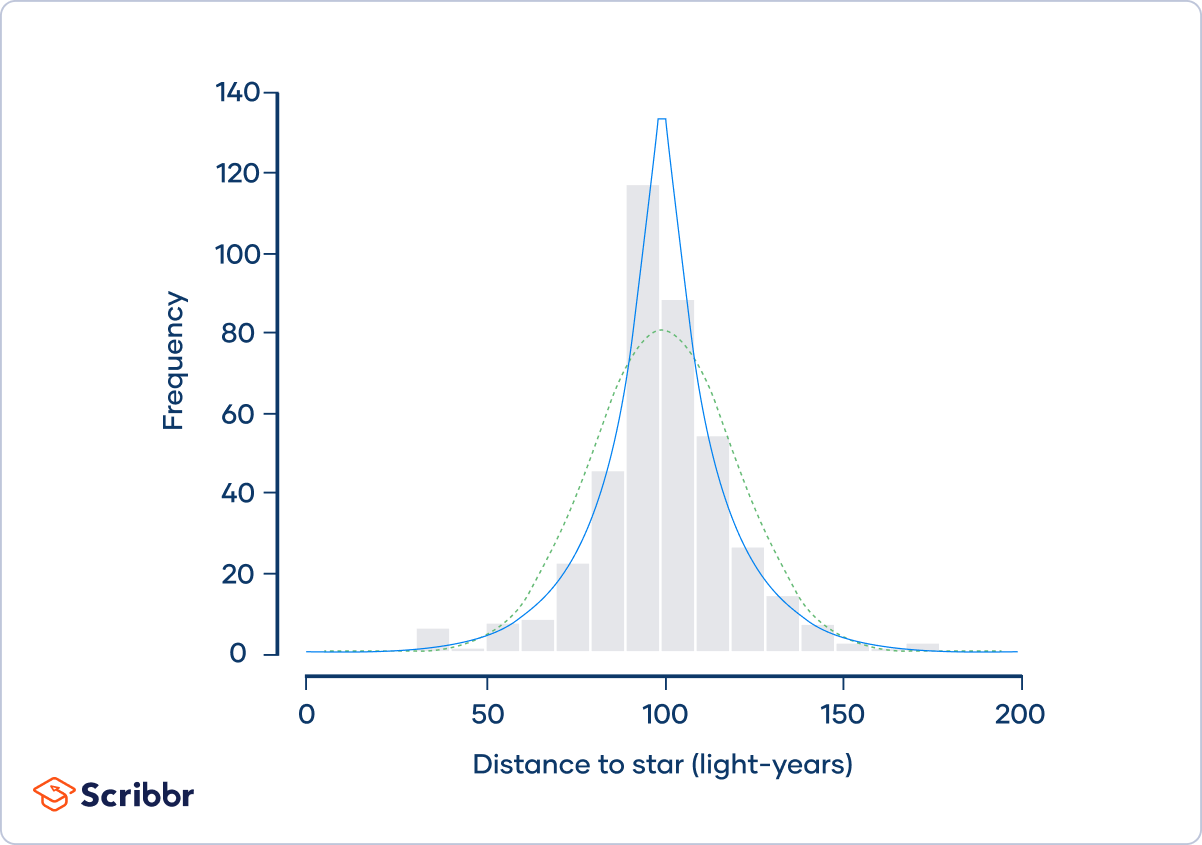
The frequency distribution (shown by the gray bars) doesn’t follow a normal distribution (shown by the dotted green curve). Instead, it approximately follows a Laplace distribution (shown by the blue curve). Laplace distributions are leptokurtic.
The astronomers calculate that the kurtosis of the sample is 6.54 and its excess kurtosis is 3.54. They conclude that the distribution is leptokurtic.
Leptokurtic distributions have frequent outliers. The distribution of the astronomers’ measurements has more outliers than you would expect if the distribution were normal, with several extreme observations that are less than 50 or more than 150 light-years.
How to calculate kurtosis
Mathematically speaking, kurtosis is the standardized fourth moment of a distribution. Moments are a set of measurements that tell you about the shape of a distribution.
Moments are standardized by dividing them by the standard deviation raised to the appropriate power.
Kurtosis of a population
The following formula describes the kurtosis of a population:

Where:
 is the standardized fourth moment
 is the unstandardized central fourth moment
 is the standard deviation
 is the standardized fourth moment
 is the unstandardized central fourth moment
 is the standard deviation
Kurtosis of a sample
The kurtosis of a sample is an estimate of the kurtosis of the population.
It might seem natural to calculate a sample’s kurtosis as the fourth moment of the sample divided by its standard deviation to the fourth power. However, this leads to a biased estimate.
The formula for the unbiased estimate of excess kurtosis includes a lengthy correction based on the sample size:

Where
- is the sample size
 are observations of the variable
 is the mean of the variable
 is the sample size
 are observations of the variable
 is the
 It’s time-consuming to calculate kurtosis by hand. For this reason, most people use computer software to calculate it. For example, the KURT() function in Excel calculates kurtosis using the above formula.
Other interesting articles
If you want to know more about statistics, methodology, or research bias, make sure to check out some of our other articles with explanations and examples.
Statistics
Methodology
Frequently asked questions about kurtosis

Cite this Scribbr article
If you want to cite this source, you can copy and paste the citation or click the “Cite this Scribbr article” button to automatically add the citation to our free Citation Generator.
Turney, S. (2024, January 29). What Is Kurtosis? | Definition, Examples & Formula. Scribbr. Retrieved June 23, 2026, from https://www.scribbr.com/statistics/kurtosis/