The Standard Normal Distribution | Calculator, Examples & Uses
The standard normal distribution, also called the z-distribution, is a special normal distribution where the mean is 0 and the standard deviation is 1.
Any normal distribution can be standardized by converting its values into z scores. Z scores tell you how many standard deviations from the mean each value lies.

Converting a normal distribution into a z-distribution allows you to calculate the probability of certain values occurring and to compare different data sets.
Table of contents
- Standard normal distribution calculator
- Normal distribution vs the standard normal distribution
- Standardizing a normal distribution
- Use the standard normal distribution to find probability
- Step-by-step example of using the z distribution
- Other interesting articles
- Frequently asked questions about the standard normal distribution
Standard normal distribution calculator
You can calculate the standard normal distribution with our calculator below.

Normal distribution vs the standard normal distribution
All normal distributions, like the standard normal distribution, are unimodal and symmetrically distributed with a bell-shaped curve. However, a normal distribution can take on any value as its mean and standard deviation. In the standard normal distribution, the mean and standard deviation are always fixed.
Every normal distribution is a version of the standard normal distribution that’s been stretched or squeezed and moved horizontally right or left.
The mean determines where the curve is centered. Increasing the mean moves the curve right, while decreasing it moves the curve left.
The standard deviation stretches or squeezes the curve. A small standard deviation results in a narrow curve, while a large standard deviation leads to a wide curve.

| Curve | Position or shape (relative to standard normal distribution) |
|---|---|
| A (M = 0, SD = 1) | Standard normal distribution |
| B (M = 0, SD = 0.5) | Squeezed, because SD < 1 |
| C (M = 0, SD = 2) | Stretched, because SD > 1 |
| D (M = 1, SD = 1) | Shifted right, because M > 0 |
| E (M = –1, SD = 1) | Shifted left, because M < 0 |
Standardizing a normal distribution
When you standardize a normal distribution, the mean becomes 0 and the standard deviation becomes 1. This allows you to easily calculate the probability of certain values occurring in your distribution, or to compare data sets with different means and standard deviations.
While data points are referred to as x in a normal distribution, they are called z or z scores in the z distribution. A z score is a standard score that tells you how many standard deviations away from the mean an individual value (x) lies:
- A positive z score means that your x value is greater than the mean.
- A negative z score means that your x value is less than the mean.
- A z score of zero means that your x value is equal to the mean.
Converting a normal distribution into the standard normal distribution allows you to:
- Compare scores on different distributions with different means and standard deviations.
- Normalize scores for statistical decision-making (e.g., grading on a curve).
- Find the probability of observations in a distribution falling above or below a given value.
- Find the probability that a sample mean significantly differs from a known population mean.
How to calculate a z score
To standardize a value from a normal distribution, convert the individual value into a z-score:
- Subtract the mean from your individual value.
- Divide the difference by the standard deviation.
| Z-score formula | Explanation |
|---|---|
 |
|
To standardize your data, you first find the z score for 1380. The z score tells you how many standard deviations away 1380 is from the mean.
| Step 1: Subtract the mean from the x value. | x = 1380 M = 1150 x – M = 1380 − 1150 = 230 |
|---|---|
| Step 2: Divide the difference by the standard deviation. | SD = 150 z = 230 ÷ 150 = 1.53 |
The z score for a value of 1380 is 1.53. That means 1380 is 1.53 standard deviations from the mean of your distribution.
Next, we can find the probability of this score using a z table.
Use the standard normal distribution to find probability
The standard normal distribution is a probability distribution, so the area under the curve between two points tells you the probability of variables taking on a range of values. The total area under the curve is 1 or 100%.
Every z score has an associated p value that tells you the probability of all values below or above that z score occuring. This is the area under the curve left or right of that z score.

Z tests and p values
The z score is the test statistic used in a z test. The z test is used to compare the means of two groups, or to compare the mean of a group to a set value. Its null hypothesis typically assumes no difference between groups.
The area under the curve to the right of a z score is the p value, and it’s the likelihood of your observation occurring if the null hypothesis is true.
Usually, a p value of 0.05 or less means that your results are unlikely to have arisen by chance; it indicates a statistically significant effect.
By converting a value in a normal distribution into a z score, you can easily find the p value for a z test.
How to use a z table
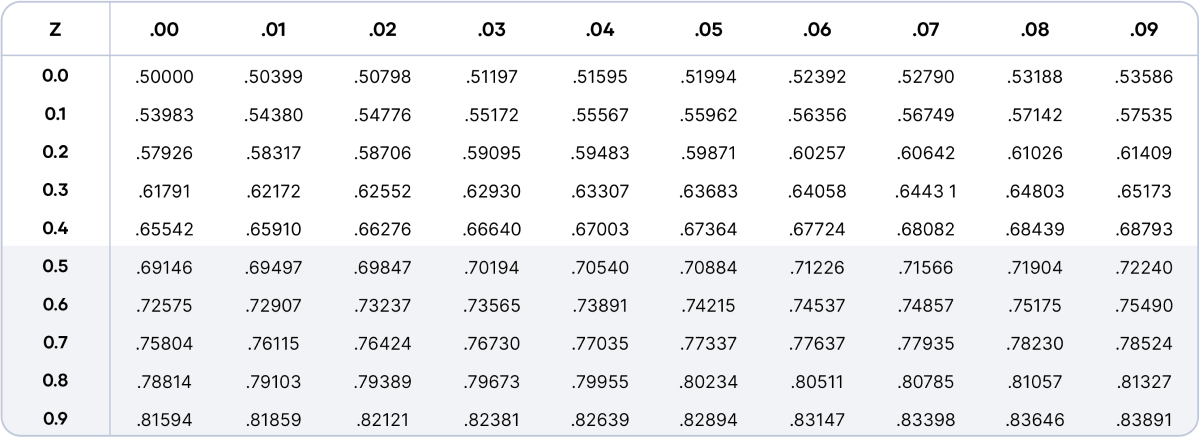
Once you have a z score, you can look up the corresponding probability in a z table.
In a z table, the area under the curve is reported for every z value between -4 and 4 at intervals of 0.01.
There are a few different formats for the z table. Here, we use a portion of the cumulative table. This table tells you the total area under the curve up to a given z score—this area is equal to the probability of values below that z score occurring.
The first column of a z table contains the z score up to the first decimal place. The top row of the table gives the second decimal place.
To find the corresponding area under the curve (probability) for a z score:
- Go down to the row with the first two digits of your z score.
- Go across to the column with the same third digit as your z score.
- Find the value at the intersection of the row and column from the previous steps.
This is the probability of SAT scores being 1380 or less (93.7%), and it’s the area under the curve left of the shaded area.
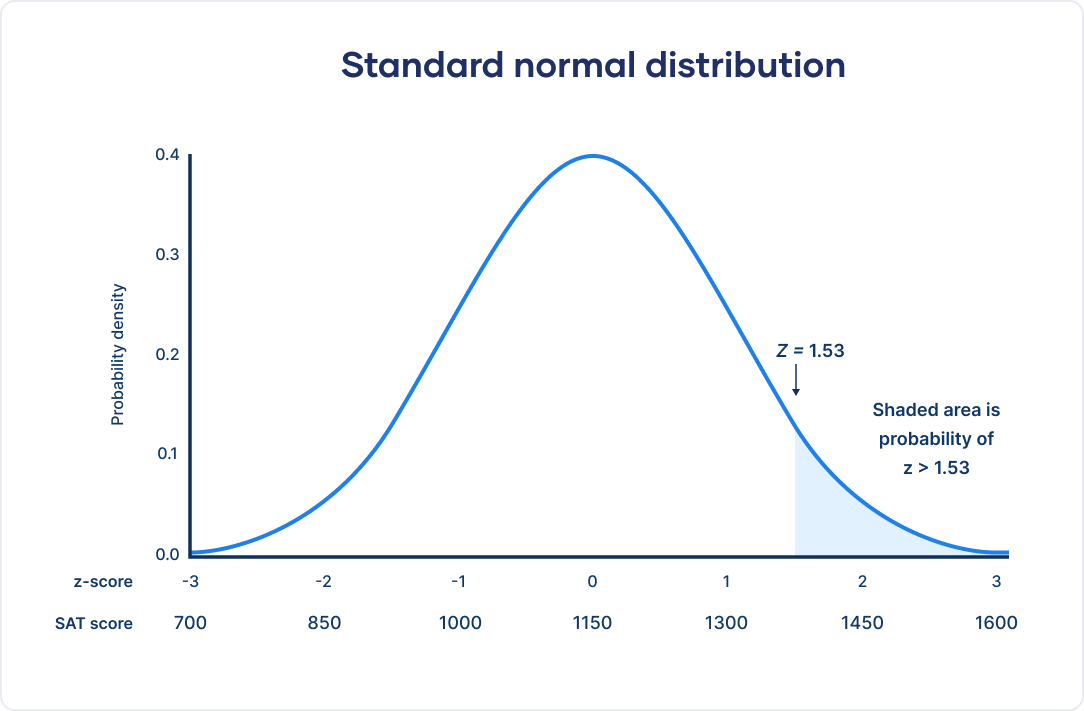
To find the shaded area, you take away 0.937 from 1, which is the total area under the curve.
Probability of x > 1380 = 1 − 0.937 = 0.063
That means it’s likely that only 6.3% of SAT scores in your sample exceed 1380.
Step-by-step example of using the z distribution
Let’s walk through an invented research example to better understand how the standard normal distribution works.
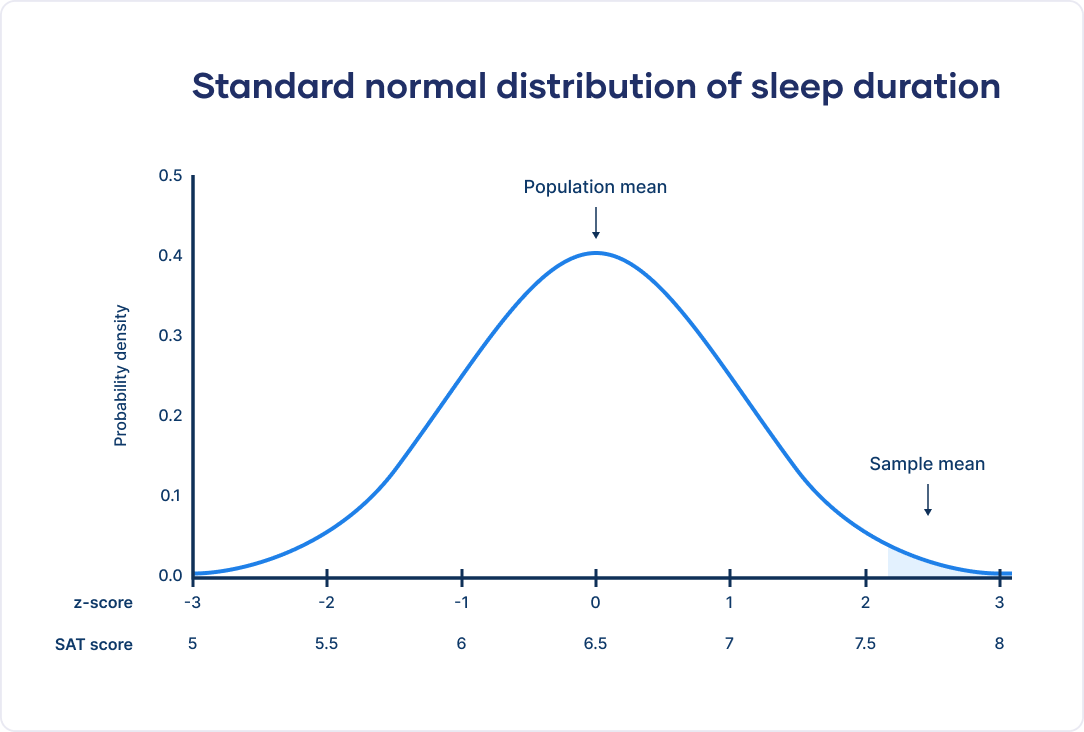
As a sleep researcher, you’re curious about how sleep habits changed during COVID-19 lockdowns. You collect sleep duration data from a sample during a full lockdown.
Before the lockdown, the population mean was 6.5 hours of sleep. The lockdown sample mean is 7.62.
To assess whether your sample mean significantly differs from the pre-lockdown population mean, you perform a z test:
- First, you calculate a z score for the sample mean value.
- Then, you find the p value for your z score using a z table.
Step 1: Calculate a z-score
To compare sleep duration during and before the lockdown, you convert your lockdown sample mean into a z score using the pre-lockdown population mean and standard deviation.
| Formula | Explanation | Calculation |
|---|---|---|
|
x = sample mean μ = population mean σ = population standard deviation |
    |
A z score of 2.24 means that your sample mean is 2.24 standard deviations greater than the population mean.
Step 2: Find the p value
To find the probability of your sample mean z score of 2.24 or less occurring, you use the z table to find the value at the intersection of row 2.2 and column +0.04.
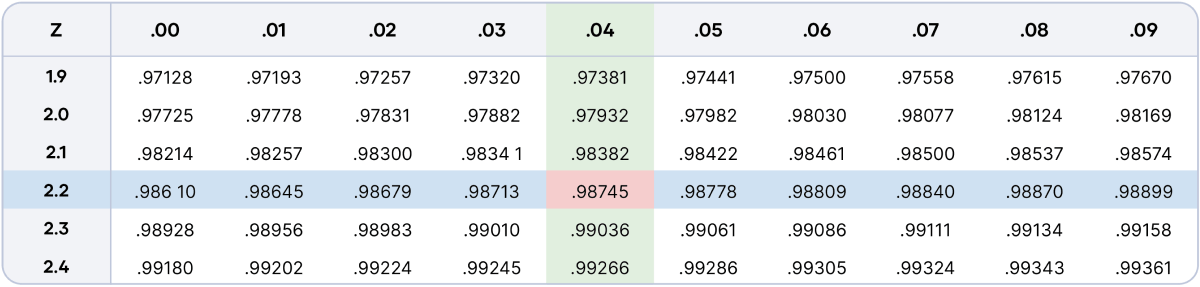
The table tells you that the area under the curve up to or below your z score is 0.9874. This means that your sample’s mean sleep duration is higher than about 98.74% of the population’s mean sleep duration pre-lockdown.
To find the p value to assess whether the sample differs from the population, you calculate the area under the curve above or to the right of your z score. Since the total area under the curve is 1, you subtract the area under the curve below your z score from 1.
A p value of less than 0.05 or 5% means that the sample significantly differs from the population.
Probability of z > 2.24 = 1 − 0.9874 = 0.0126 or 1.26%
With a p value of less than 0.05, you can conclude that average sleep duration in the COVID-19 lockdown was significantly higher than the pre-lockdown average.
Other interesting articles
If you want to know more about statistics, methodology, or research bias, make sure to check out some of our other articles with explanations and examples.
Statistics
Methodology
Frequently asked questions about the standard normal distribution

Cite this Scribbr article
If you want to cite this source, you can copy and paste the citation or click the “Cite this Scribbr article” button to automatically add the citation to our free Citation Generator.
Bhandari, P. (2023, June 21). The Standard Normal Distribution | Calculator, Examples & Uses. Scribbr. Retrieved July 23, 2026, from https://www.scribbr.com/statistics/standard-normal-distribution/
