Regression to the Mean | Definition & Examples
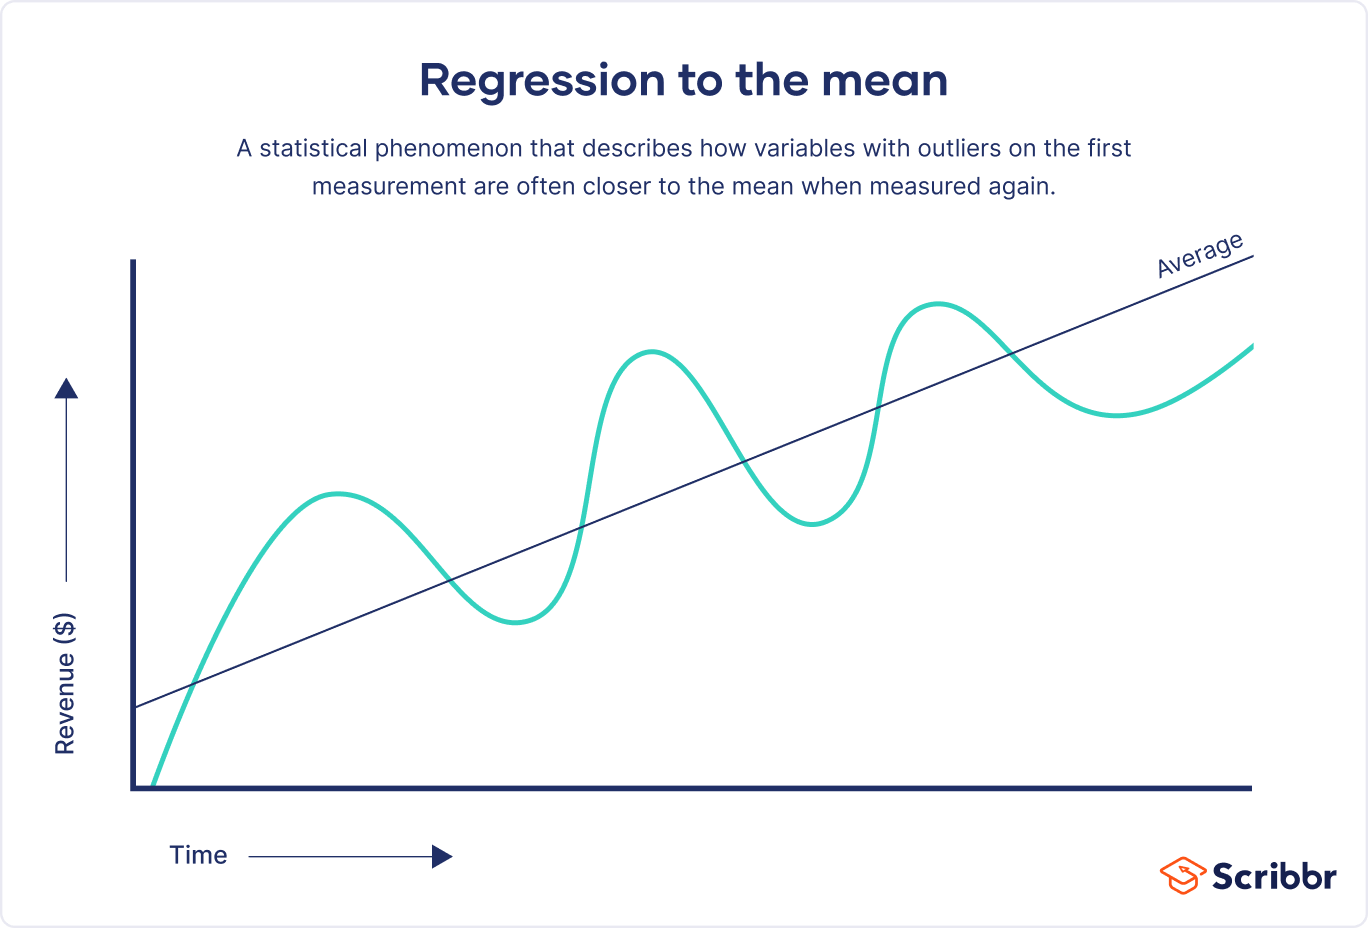
Regression to the mean (RTM) is a statistical phenomenon describing how variables much higher or lower than the mean are often much closer to the mean when measured a second time.
Regression to the mean is due to natural variation or chance. It can be observed in everyday life, particularly in research that intentionally focuses on the most extreme cases or events. It is sometimes also called regression toward the mean.
Players or teams featured on the cover of SI have earned their place by performing exceptionally well. But athletic success is a mix of skill and luck, and even the best players don’t always win.
Chances are that good luck will not continue indefinitely, and neither can exceptional success.
In other words, due to RTM, a great performance is more likely to be followed by a mediocre one than another great one, giving the impression that appearing on the cover brings bad luck.
Regression to the mean is common in repeated measurements (within-subject designs) and should always be considered as a possible cause of an observed change. It is considered a type of information bias and can distort research findings.
What is regression to the mean?
Regression to the mean is observed when variables that are extremely higher or extremely lower than average on the first measurement move closer to the average on the second measurement.
In general, RTM explains why unusual events are likely to be followed by more typical ones. Suppose that a company has a great quarter, exceeding all targets set. As exceptional performance is difficult to maintain over time, there is a high chance of worse performance in the next quarter, shifting the performance of the company back towards the mean. Anything that can be influenced by an element of chance is subject to this phenomenon.
Regression to the mean occurs when a nonrandom sample is selected from a population and you measure two imperfectly correlated variables, such as two consecutive blood pressure measurements.
- The smaller the correlation between the two variables, the larger the effect of RTM.
- The more extreme the value from the population mean, the more room there is to regress to the mean.
Regression to the mean can be explained by considering, for example, that skill and performance are imperfectly correlated due to the role of luck. This may lead you to find a causal relationship where there isn’t one.
Why is regression to the mean a problem?
Regression to the mean can prove problematic particularly in research studies that measure the effectiveness of an intervention, program, or policy.
It can mislead researchers to believe that an intervention is the cause of an observed change, when in reality it is due to chance. This is particularly evident when researchers focus on measurements of people, cases, or organizations at the extremes, such as the worst-performing, the best-educated, or the unhealthiest.
RTM shows us that, statistically, the lowest cases are likely to improve the second time, while those at their peak will likely perform worse even without the intervention. Because it can distort results, you need to take regression to the mean into account when designing your research as well as when analyzing your findings.
Otherwise, you run the risk of attributing certain results to a particular cause, when in reality they were most likely due to chance.
Regression to the mean examples
Regression to the mean often happens when measuring the effects of an intervention.
To find out which students are most in need, you administer a math test to a class of 8th-grade students. You pick the worst-performing 10% of students, and assign them to the online course.
When the course is complete, the 10% of students with the worst performance take another test. Their scores, on average, show improvement. The principal, pleased with the result, decides to launch the online course for all 8th-grade students who are underperforming in math.
At the end of the year, these students’ scores are not much better than they were the previous year. They certainly didn’t improve to the degree you expected based upon the results of the worst-performing 10% of students.
The problem here is regression to the mean. Among the students who did poorly on the first test were also students who didn’t perform well due to chance: perhaps they didn’t sleep well the night before, or they were sick or stressed out. These students were going to do better on the second test regardless of the intervention (the online program). Thus, they brought up the average score of the worst-performing 10%.
Relatedly, randomized evaluations are essential in avoiding regression to the mean when estimating the effects of an intervention.
Among people with a specific disease, like the flu, symptoms vary. If researchers try out new drugs or treatments only on patients who are severely ill, regression to the mean may affect the results of an experiment.
People with severe symptoms essentially have characteristics that deviate from the population mean. Because of that, they often respond more strongly to an intervention than people with milder symptoms.
When something is measured as extreme in the first instance, it is likely to be measured as less extreme later on. As many diseases have a natural ebb and flow, treating patients at their worst will make almost any treatment appear to work.
For this reason, patients at all symptom levels should be treated, in order to test the true effectiveness of the treatment.
How to avoid regression to the mean
The best way to avoid regression to the mean is to account for it during the design phase of your research. Whenever possible, use a probability sampling method. Otherwise, your results may lean towards the extremes, either abnormally high or abnormally low for the average. These will, by design, regress towards the mean upon retesting.
In experimental designs, it is important to use a control group and a treatment group, randomly assigning participants to each one. Changes in the control group can help you evaluate the extent of changes caused by regression to the mean, in addition to any placebo effect. Any extra improvement or deterioration in the experimental group compared to the control group can be attributed to the intervention, so long as it is statistically significant.
Calculating the percent of regression to the mean
Alternatively, you can calculate the percent of regression to the mean during your data analysis. You can use the formula below to calculate regression to the mean.
- When there is perfect correlation between your variables, then r = 1
- Using the formula above, Prm = 100(1 – 1) = 0
- In other words, if your variables are perfectly correlated, they will not regress to the mean.
- On the contrary, when there is no correlation (r = 0), there is 100% regression to the mean.
- When there is imperfect correlation between your variables, then r is between –1 and +1.
If your example r = 0.2, there is 80% regression to the mean:
- Prm = 100(1 – 0.2)
- Prm = 100(0.8)
- Prm = 80%
Other types of research bias
Frequently asked questions
Cite this Scribbr article
If you want to cite this source, you can copy and paste the citation or click the “Cite this Scribbr article” button to automatically add the citation to our free Citation Generator.
Nikolopoulou, K. (2023, March 24). Regression to the Mean | Definition & Examples. Scribbr. Retrieved July 1, 2026, from https://www.scribbr.com/research-bias/regression-to-the-mean/