Types of Variables in Research & Statistics | Examples
In statistical research, a variable is defined as an attribute of an object of study. Choosing which variables to measure is central to good experimental design.
Example
If you want to test whether some plant species are more salt-tolerant than others, some key variables you might measure include the amount of salt you add to the water, the species of plants being studied, and variables related to plant health like growth and wilting.
You need to know which types of variables you are working with in order to choose appropriate statistical tests and interpret the results of your study.
You can usually identify the type of variable by asking two questions:
- What type of data does the variable contain?
- What part of the experiment does the variable represent?
Types of data: Quantitative vs categorical variables
Data is a specific measurement of a variable – it is the value you record in your data sheet. Data is generally divided into two categories:
- Quantitative data represents amounts
- Categorical data represents groupings
A variable that contains quantitative data is a quantitative variable; a variable that contains categorical data is a categorical variable. Each of these types of variables can be broken down into further types.
Quantitative variables
When you collect quantitative data, the numbers you record represent real amounts that can be added, subtracted, divided, etc. There are two types of quantitative variables: discrete and continuous.
| Type of variable | What does the data represent? | Examples |
|---|---|---|
| Discrete variables (aka integer variables) | Counts of individual items or values. |
|
| Continuous variables (aka ratio variables) | Measurements of continuous or non-finite values. |
|
Categorical variables
Categorical variables represent groupings of some kind. They are sometimes recorded as numbers, but the numbers represent categories rather than actual amounts of things.
There are three types of categorical variables: binary, nominal, and ordinal variables.
| Type of variable | What does the data represent? | Examples |
|---|---|---|
| Binary variables (aka dichotomous variables) | Yes or no outcomes. |
|
| Nominal variables | Groups with no rank or order between them. |
|
| Ordinal variables | Groups that are ranked in a specific order. |
|
*Note that sometimes a variable can work as more than one type! An ordinal variable can also be used as a quantitative variable if the scale is numeric and doesn’t need to be kept as discrete integers. For example, star ratings on product reviews are ordinal (1 to 5 stars), but the average star rating is quantitative.
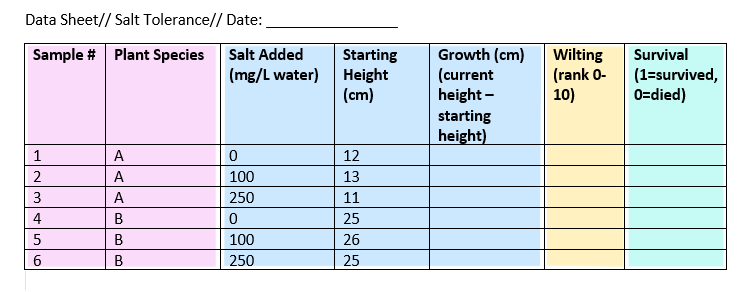
Example data sheet
To keep track of your salt-tolerance experiment, you make a data sheet where you record information about the variables in the experiment, like salt addition and plant health.
To gather information about plant responses over time, you can fill out the same data sheet every few days until the end of the experiment. This example sheet is color-coded according to the type of variable: nominal, continuous, ordinal, and binary.
Here's why students love Scribbr's proofreading services
Parts of the experiment: Independent vs dependent variables
Experiments are usually designed to find out what effect one variable has on another – in our example, the effect of salt addition on plant growth.
You manipulate the independent variable (the one you think might be the cause) and then measure the dependent variable (the one you think might be the effect) to find out what this effect might be.
You will probably also have variables that you hold constant (control variables) in order to focus on your experimental treatment.
| Type of variable | Definition | Example (salt tolerance experiment) |
|---|---|---|
| Independent variables (aka treatment variables) | Variables you manipulate in order to affect the outcome of an experiment. | The amount of salt added to each plant’s water. |
| Dependent variables (aka response variables) | Variables that represent the outcome of the experiment. | Any measurement of plant health and growth: in this case, plant height and wilting. |
| Control variables | Variables that are held constant throughout the experiment. | The temperature and light in the room the plants are kept in, and the volume of water given to each plant. |
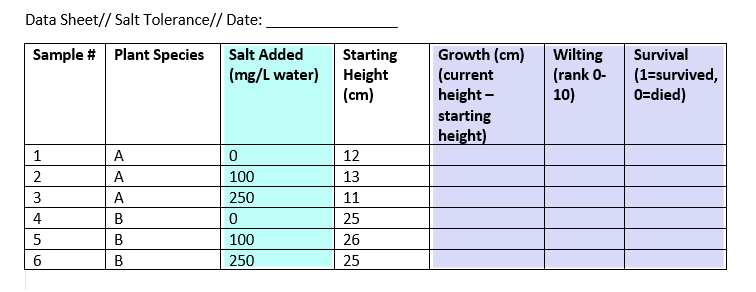
Example data sheet
In this experiment, we have one independent and three dependent variables.
The other variables in the sheet can’t be classified as independent or dependent, but they do contain data that you will need in order to interpret your dependent and independent variables.
What about correlational research?
When you do correlational research, the terms “dependent” and “independent” don’t apply, because you are not trying to establish a cause and effect relationship (causation).
However, there might be cases where one variable clearly precedes the other (for example, rainfall leads to mud, rather than the other way around). In these cases you may call the preceding variable (i.e., the rainfall) the predictor variable and the following variable (i.e. the mud) the outcome variable.
Other common types of variables
Once you have defined your independent and dependent variables and determined whether they are categorical or quantitative, you will be able to choose the correct statistical test.
But there are many other ways of describing variables that help with interpreting your results. Some useful types of variables are listed below.
| Type of variable | Definition | Example (salt tolerance experiment) |
|---|---|---|
| Confounding variables | A variable that hides the true effect of another variable in your experiment. This can happen when another variable is closely related to a variable you are interested in, but you haven’t controlled it in your experiment. Be careful with these, because confounding variables run a high risk of introducing a variety of research biases to your work, particularly omitted variable bias. | Pot size and soil type might affect plant survival as much or more than salt additions. In an experiment you would control these potential confounders by holding them constant. |
| Latent variables | A variable that can’t be directly measured, but that you represent via a proxy. | Salt tolerance in plants cannot be measured directly, but can be inferred from measurements of plant health in our salt-addition experiment. |
| Composite variables | A variable that is made by combining multiple variables in an experiment. These variables are created when you analyze data, not when you measure it. | The three plant health variables could be combined into a single plant-health score to make it easier to present your findings. |
Other interesting articles
If you want to know more about statistics, methodology, or research bias, make sure to check out some of our other articles with explanations and examples.
Statistics
Methodology
Frequently asked questions about variables
Cite this Scribbr article
If you want to cite this source, you can copy and paste the citation or click the “Cite this Scribbr article” button to automatically add the citation to our free Citation Generator.
Bevans, R. (2023, June 21). Types of Variables in Research & Statistics | Examples. Scribbr. Retrieved June 23, 2026, from https://www.scribbr.com/methodology/types-of-variables/
