What Is a Likert Scale? | Guide & Examples
A Likert scale is a rating scale used to measure opinions, attitudes, or behaviors.
It consists of a statement or a question, followed by a series of five or seven answer statements. Respondents choose the option that best corresponds with how they feel about the statement or question.
Because respondents are presented with a range of possible answers, Likert scales are great for capturing the level of agreement or their feelings regarding the topic in a more nuanced way. However, Likert scales are prone to response bias, where respondents either agree or disagree with all the statements due to fatigue or social desirability or have a tendency toward extreme responding or other demand characteristics.
Likert scales are common in survey research, as well as in fields like marketing, psychology, or other social sciences.
Download Likert scale response options
Table of contents
What are Likert scale questions?
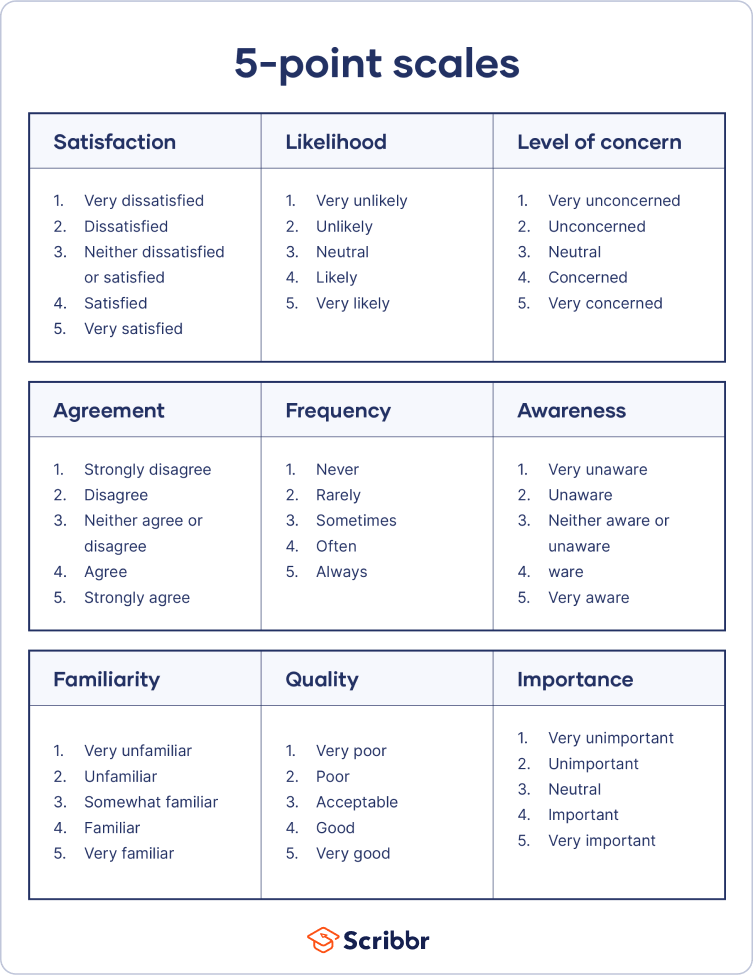
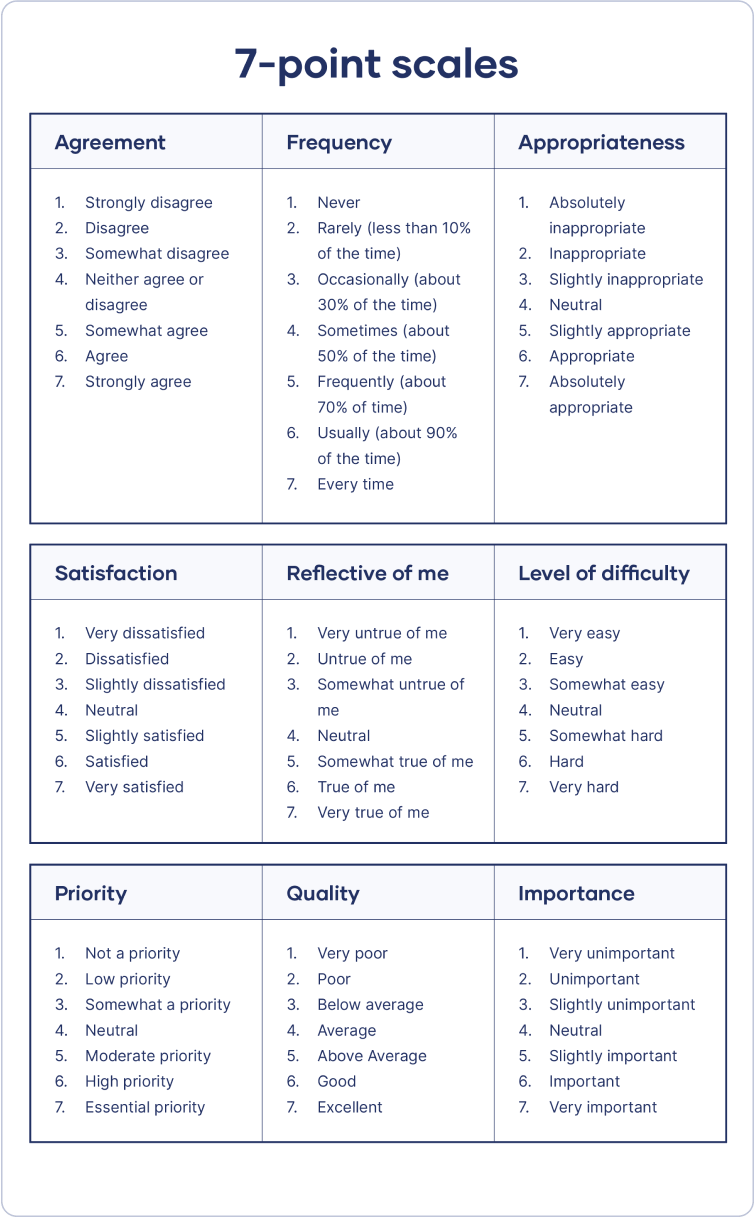
Likert scales commonly comprise either five or seven options. The options on each end are called response anchors. The midpoint is often a neutral item, with positive options on one side and negative options on the other. Each item is given a score from 1 to 5 or 1 to 7.
The format of a typical five-level Likert question, for example, could be:
- Strongly disagree
- Disagree
- Neither agree nor disagree
- Agree
- Strongly agree
In addition to measuring the level of agreement or disagreement, Likert scales can also measure other spectrums, such as frequency, satisfaction, or importance.

When to use Likert scale questions
Researchers use Likert scale questions when they are seeking a greater degree of nuance than possible from a simple “yes or no” question.
For example, let’s say you are conducting a survey about customer views on a pair of running shoes. You ask survey respondents “Are you satisfied with the shoes you purchased?”
- Yes
- No
A dichotomous question like the above gives you very limited information. There is no way you can tell how satisfied or dissatisfied customers really are. You get more specific and interesting information by asking a Likert scale question instead:
“How satisfied are you with the shoes you purchased?”
- 1 – Very dissatisfied
- 2 – Dissatisfied
- 3 – Unsure
- 4 – Satisfied
- 5 – Very satisfied
Likert scales are most useful when you are measuring unobservable individual characteristics, or characteristics that have no concrete, objective measurement. These can be elements like attitudes, feelings, or opinions that cause variations in behavior.
How to write strong Likert scale questions
Each Likert scale–style question should assess a single attitude or trait. In order to get accurate results, it is important to word your questions precisely. As a rule of thumb, make sure each question only measures one aspect of your topic.
For example, if you want to assess attitudes towards environmentally friendly behaviors, you can design a Likert scale with a variety of questions that measure different aspects of this topic.
Here are a few pointers:
- Include both questions and statements
- Use both positive and negative framing
- Avoid double negatives
- Ask about only one thing at a time
- Be crystal clear
Include both questions and statements
A good rule of thumb is to use a mix of both to keep your participants engaged during the survey. When deciding how to phrase questions and statements, it’s important that they are easily understood and do not bias your respondents in one way or another.
Use both positive and negative framing
If all of your questions only ask about things in socially desirable ways, your participants may be biased towards agreeing with all of them to show themselves in a positive light.
| Environmental damage caused by single-use water bottles is a serious problem. | ||||
|---|---|---|---|---|
| Strongly disagree | Disagree | Neither agree nor disagree | Agree | Strongly agree |
| Banning single-use water bottles is pointless for reducing environmental damage. | ||||
|---|---|---|---|---|
| Strongly disagree | Disagree | Neither agree nor disagree | Agree | Strongly agree |
Respondents who agree with the first statement should also disagree with the second. By including both of these statements in a long survey, you can also check whether the participants’ responses are reliable and consistent.
Avoid double negatives
Double negatives can lead to confusion and misinterpretations, as respondents may be unsure of what they are agreeing or disagreeing with.
| I never buy non-organic products. | ||||
|---|---|---|---|---|
| Strongly disagree | Disagree | Neither agree nor disagree | Agree | Strongly agree |
| I try to buy organic products whenever possible. | ||||
|---|---|---|---|---|
| Strongly disagree | Disagree | Neither agree nor disagree | Agree | Strongly agree |
Ask about only one thing at a time
Avoid double-barreled questions (asking about two different topics within the same question). When faced with such questions, your respondents may selectively answer about one topic and ignore the other. Questions like this may also confuse respondents, leading them to choose a neutral but inaccurate answer in an attempt to answer both questions simultaneously.
| How would you rate your knowledge of climate change and food systems? | ||||
|---|---|---|---|---|
| Very poor | Poor | Fair | Good | Excellent |
| How would you rate your knowledge of climate change? | ||||
|---|---|---|---|---|
| Very poor | Poor | Fair | Good | Excellent |
| How would you rate your knowledge of food systems? | ||||
|---|---|---|---|---|
| Very poor | Poor | Fair | Good | Excellent |
Be crystal clear
The accuracy of your data also relies heavily on word choice:
- Pose your questions clearly, leaving no room for misunderstanding.
- Make language and stylistic choices that resonate with your target demographic.
- Stay away from jargon that could discourage or confuse your respondents.
How to write Likert scale responses
When using Likert scales, how you phrase your response options is just as crucial as how you phrase your questions.
Here are a few tips to keep in mind.
- Decide on a number of response options
- Choose the type of response option
- Choose between unipolar and bipolar options
- Make sure that you use mutually exclusive options
Decide on a number of response options
More options give you deeper insights but can make it harder for participants to decide on one answer. Fewer options mean you capture less detail, but the scale is more user-friendly.
Usually, researchers include five or seven response options. It’s a good idea to include an odd number so that there is a midpoint. However, if you want to force your respondents to choose, an even number of responses removes the neutral option.
| How frequently do you buy biodegradable products? | ||||
|---|---|---|---|---|
| Never | Occasionally | Sometimes | Often | Always |
| How frequently do you buy biodegradable products? | ||||||
|---|---|---|---|---|---|---|
| Never | Rarely | Occasionally | Sometimes | Often | Very often | Always |
Choose the type of response option
You can measure a wide range of perceptions, motivations, and intentions using Likert scales. Response options should strive to cover the full range of opinions you anticipate a participant can have.
Some of the most common types of items include:
- Agreement: Strongly Agree, Agree, Neither Agree nor Disagree, Disagree, Strongly Disagree
- Quality: Very Poor, Poor, Fair, Good, Excellent
- Likelihood: Extremely Unlikely, Somewhat Unlikely, Likely, Somewhat Likely, Extremely Likely
- Experience: Very Negative, Somewhat Negative, Neutral, Somewhat Positive, Very Positive
Some researchers also include a “don’t know” option. This allows them to distinguish between respondents who do not feel sufficiently informed to give an opinion and those who are “neutral” on the topic. However, including a “don’t know” option may trigger unmotivated respondents to select that for every question.
Choose between unipolar and bipolar options
On a unipolar scale, you measure only one attribute (e.g., satisfaction). On a bipolar scale, you can measure two attributes (e.g., satisfaction or dissatisfaction) along a continuum.
| How satisfied are you with the range of organic products available? | ||||
|---|---|---|---|---|
| Not at all satisfied | Somewhat satisfied | Satisfied | Very satisfied | Extremely satisfied |
| How satisfied are you with the range of organic products available? | ||||
|---|---|---|---|---|
| Extremely dissatisfied | Dissatisfied | Neither dissatisfied nor satisfied | Satisfied | Extremely satisfied |
Your choice depends on your research questions and aims. If you want finer-grained details about one attribute, select unipolar items. If you want to allow a broader range of responses, select bipolar items.
Unipolar scales are most accurate when five-point scales are used. Conversely, bipolar scales are most accurate when a seven-point scale is used (with three scale points on each side of a truly neutral midpoint.)
Make sure that you use mutually exclusive options
Avoid overlaps in the response items. If two items have similar meanings, it risks making your respondent’s choice random.
| Environmental damage caused by single-use water bottles is a serious problem. | |||||
|---|---|---|---|---|---|
| Strongly agree | Agree | Neither agree nor disagree | Indifferent | Disagree | Strongly disagree |
| Environmental damage caused by single-use water bottles is a serious problem. | ||||
|---|---|---|---|---|
| Strongly agree | Agree | Neither agree nor disagree | Disagree | Strongly disagree |
How to analyze data from a Likert scale
Before analyzing your data, it’s important to consider what type of data you are dealing with. Likert-derived data can be treated either as ordinal-level or interval-level data. However, most researchers treat Likert-derived data as ordinal: assuming there is not an equal distance between responses.
Furthermore, you need to decide which descriptive statistics and/or inferential statistics may be used to describe and analyze the data obtained from your Likert scale.
You can use descriptive statistics to summarize the data you collected in simple numerical or visual form.
- Ordinal data: To get an overall impression of your sample, you find the mode, or most common score, for each question. You also create a bar chart for each question to visualize the frequency of each item choice.
- Interval data: You add up the scores from each question to get the total score for each participant. You find the mean, or average, score and the standard deviation, or spread, of the scores for your sample.
You can use inferential statistics to test hypotheses, such as correlations between different responses or patterns in the whole dataset.
- Ordinal data: You hypothesize that knowledge of climate change is related to belief that environmental damage is a serious problem. You use a chi-square test of independence to see if these two attributes are correlated.
- Interval data: You investigate whether age is related to attitudes towards environmentally friendly behavior. Using a Pearson correlation test, you assess whether the overall score for your Likert scale is related to age.
Lastly, be sure to clearly state in your analysis whether you treat the data at interval level or at ordinal level.
Analyzing data at the ordinal level
Researchers usually treat Likert-derived data as ordinal. Here, response categories are presented in a ranking order, but the distances between the categories cannot be presumed to be equal.
For example, consider a scale where 1 = strongly agree, 2 = agree, 3 = neutral, 4 = disagree, and 5 = strongly disagree.
In this scale, 4 is more negative than 3, 2, or 1. However, it cannot be inferred that a response of 4 is twice as negative as a response of 2.
Treating Likert-derived data as ordinal, you can use descriptive statistics to summarize the data you collected in simple numerical or visual form. The median or mode generally is used as the measure of central tendency. In addition, you can create a bar chart for each question to visualize the frequency of each item choice.
Appropriate inferential statistics for ordinal data are, for example, Spearman’s correlation or a chi-square test for independence.
Analyzing data at the interval level
However, you can also choose to treat Likert-derived data at the interval level. Here, response categories are presented in a ranking order, and the distance between categories is presumed to be equal.
Appropriate inferential statistics used here are an analysis of variance (ANOVA) or Pearson’s correlation. Such analysis is legitimate, provided that you state the assumption that the data are at interval level.
In terms of descriptive statistics, you add up the scores from each question to get the total score for each participant. You find the mean, or average, score and the standard deviation, or spread, of the scores for your sample.
Advantages and disadvantages of Likert scales
Likert scales are a practical and accessible method of collecting data.
- Quantitative: Likert scales easily operationalize complex topics by breaking down abstract phenomena into recordable observations. This enables statistical testing of your hypotheses.
- Fine-grained: Because Likert-type questions aren’t binary (yes/no, true/false, etc.) you can get detailed insights into perceptions, opinions, and behaviors.
- User-friendly: Unlike open-ended questions, Likert scales are closed-ended and don’t ask respondents to generate ideas or justify their opinions. This makes them quick for respondents to fill out and ensures they can easily yield data from large samples.
Problems with Likert scales often come from inappropriate design choices.
- Response bias: Due to social desirability bias, people often avoid selecting the extreme items or disagreeing with statements to seem more “normal” or show themselves in a favorable light.
- Fatigue/inattention: In Likert scales with many questions, respondents can get bored and lose interest. They may absent-mindedly select responses regardless of their true feelings. This results in invalid responses.
- Subjective interpretation: Some items can be vague and interpreted very differently by respondents. Words like “somewhat” or “fair” don’t have precise or narrow definitions.
- Restricted choice: Since Likert-type questions are closed-ended, respondents sometimes have to choose the most relevant answer even if it may not accurately reflect reality.
Other interesting articles
If you want to know more about statistics, methodology, or research bias, make sure to check out some of our other articles with explanations and examples.
Statistics
Methodology
Frequently asked questions about Likert scales
Cite this Scribbr article
If you want to cite this source, you can copy and paste the citation or click the “Cite this Scribbr article” button to automatically add the citation to our free Citation Generator.
Bhandari, P. & Nikolopoulou, K. (2023, June 22). What Is a Likert Scale? | Guide & Examples. Scribbr. Retrieved July 9, 2026, from https://www.scribbr.com/methodology/likert-scale/
