Interval Data and How to Analyze It | Definitions & Examples
Interval data is measured along a numerical scale that has equal distances between adjacent values. These distances are called “intervals.”
There is no true zero on an interval scale, which is what distinguishes it from a ratio scale. On an interval scale, zero is an arbitrary point, not a complete absence of the variable.
Common examples of interval scales include standardized tests, such as the SAT, and psychological inventories.
Levels of measurement
Interval is one of four hierarchical levels of measurement. The levels of measurement indicate how precisely data is recorded. The higher the level, the more complex the measurement is.
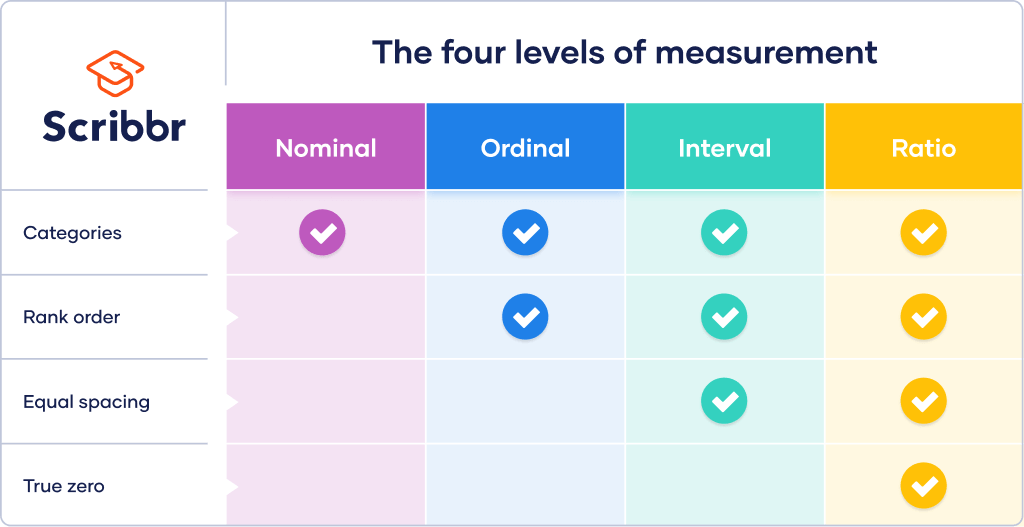
While nominal and ordinal variables are categorical, interval and ratio variables are quantitative. Many more statistical tests can be performed on quantitative than categorical data.
Here's why students love Scribbr's proofreading services
Interval vs ratio scales
Interval and ratio scales both have equal intervals between values. However, only ratio scales have a true zero that represents a total absence of the variable.
Celsius and Fahrenheit are examples of interval scales. Each point on these scales differs from neighboring points by intervals of exactly one degree. The difference between 20 and 21 degrees is identical to the difference between 225 and 226 degrees.
However, these scales have arbitrary zero points – zero degrees isn’t the lowest possible temperature.
Because there’s no true zero, you can’t multiply or divide scores on interval scales. 30°C is not twice as hot as 15°C. Similarly, -5°F is not half as cold as -10°F.
In contrast, the Kelvin temperature scale is a ratio scale. In the Kelvin scale, nothing can be colder than 0 K. Therefore, temperature ratios in Kelvin are meaningful: 20 K is twice as hot as 10 K.
Examples of interval data
Psychological concepts like intelligence are often quantified through operationalization in tests or inventories. These tests have equal intervals between scores, but they do not have true zeros because they cannot measure “zero intelligence” or “zero personality.”
| Type | Examples |
|---|---|
| Standardized tests | IQ
SAT GRE GMAT |
| Psychological inventories | Beck’s Depression Inventory
Raven’s Progressive Matrices Big Five personality trait tests |
To identify whether a scale is interval or ordinal, consider whether it uses values with fixed measurement units, where the distances between any two points are of known size. For example:
- A pain rating scale from 0 (no pain) to 10 (worst possible pain) is interval.
- A pain rating scale that goes from no pain, mild pain, moderate pain, severe pain, to the worst pain possible is ordinal.
Treating your data as interval data allows for more powerful statistical tests to be performed.
Interval data analysis
To get an overview of your data, you can first gather the following descriptive statistics:
- the frequency distribution in numbers or percentages,
- the mode, median, or mean to find the central tendency,
- the range, standard deviation and variance to indicate the variability.
Distribution
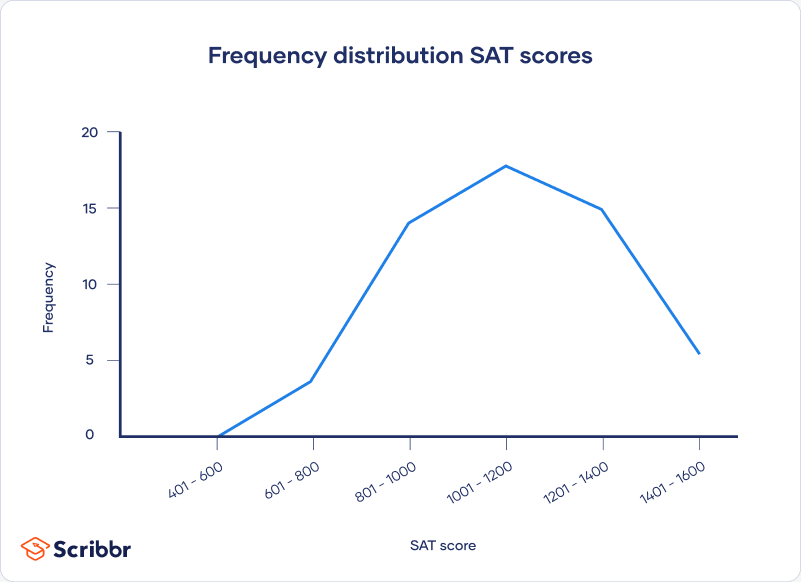
Tables and graphs can be used to organize your data and visualize its distribution.
| SAT score | Frequency |
|---|---|
| 401 – 600 | 0 |
| 601 – 800 | 4 |
| 801 – 1000 | 15 |
| 1001 – 1200 | 19 |
| 1201 – 1400 | 16 |
| 1401 – 1600 | 5 |
Central tendency
From your graph, you can see that your data is fairly normally distributed. Since there is no skew, to find where most of your values lie, you can use all 3 common measures of central tendency: the mode, median and mean.
(n+1)/2 = (59+1)/2 = 30
The median is in the 30th position, which has a value of 1120.
⅀x = 65850
n = 59
⅀x/n = 65850/59 = 1116.1
The mean is usually considered the best measure of central tendency when you have normally distributed quantitative data. That’s because it uses every single value in your data set for the computation, unlike the mode or the median.
Variability
The range, standard deviation and variance describe how spread your data is. The range is the easiest to compute while the standard deviation and variance are more complicated, but also more informative.
Range = 1500 – 620 = 880
s = 210.42
s2 = 44279.36
Statistical tests
Now that you have an overview of your data, you can select appropriate tests for making statistical inferences. With a normal distribution of interval data, both parametric and non-parametric tests are possible.
Parametric tests are more statistically powerful than non-parametric tests and let you make stronger conclusions regarding your data. However, your data must meet several requirements for parametric tests to apply.
The following parametric tests are some of the most common ones applied to test hypotheses about interval data.
| Aim | Samples or variables | Test | Example |
|---|---|---|---|
| Comparison of means | 2 samples | T-test | What is the difference in the average SAT scores of students from 2 different high schools? |
| Comparison of means | 3 or more samples | ANOVA | What is the difference in the average SAT scores of students from 3 test prep programs? |
| Correlation | 2 variables | Pearson’s r | How are SAT scores and GPAs related? |
| Regression | 2 variables | Simple linear regression | What is the effect of parental income on SAT scores? |
Here's why students love Scribbr's proofreading services
Other interesting articles
If you want to know more about statistics, methodology, or research bias, make sure to check out some of our other articles with explanations and examples.
Statistics
Methodology
Frequently asked questions about interval data
Cite this Scribbr article
If you want to cite this source, you can copy and paste the citation or click the “Cite this Scribbr article” button to automatically add the citation to our free Citation Generator.
Bhandari, P. (2023, June 21). Interval Data and How to Analyze It | Definitions & Examples. Scribbr. Retrieved July 23, 2026, from https://www.scribbr.com/statistics/interval-data/
