How to Find Outliers | 4 Ways with Examples & Explanation
Outliers are extreme values that differ from most other data points in a dataset. They can have a big impact on your statistical analyses and skew the results of any hypothesis tests.
It’s important to carefully identify potential outliers in your dataset and deal with them in an appropriate manner for accurate results.
What are outliers?
Outliers are values at the extreme ends of a dataset.
Some outliers represent true values from natural variation in the population. Other outliers may result from incorrect data entry, equipment malfunctions, or other measurement errors.
An outlier isn’t always a form of dirty or incorrect data, so you have to be careful with them in data cleansing. What you should do with an outlier depends on its most likely cause.
True outliers
True outliers should always be retained in your dataset because these just represent natural variations in your sample.
Most values are centered around the middle, as expected. But these extreme values also represent natural variations because a variable like running time is influenced by many other factors.
True outliers are also present in variables with skewed distributions where many data points are spread far from the mean in one direction. It’s important to select appropriate statistical tests or measures when you have a skewed distribution or many outliers.
Other outliers
Outliers that don’t represent true values can come from many possible sources:
- Measurement errors
- Data entry or processing errors
- Unrepresentative sampling
For one of the participants, you accidentally start the timer midway through their sprint. You record this timing as their running time.
This data point is a big outlier in your dataset because it’s much lower than all of the other times.
This type of outlier is problematic because it’s inaccurate and can distort your research results.
The average is much lower when you include the outlier compared to when you exclude it. Your standard deviation also increases when you include the outlier, so your statistical power is lower as well.
In practice, it can be difficult to tell different types of outliers apart. While you can use calculations and statistical methods to detect outliers, classifying them as true or false is usually a subjective process.
Here's why students love Scribbr's proofreading services
Four ways of calculating outliers
You can choose from several methods to detect outliers depending on your time and resources.
Sorting method
You can sort quantitative variables from low to high and scan for extremely low or extremely high values. Flag any extreme values that you find.
This is a simple way to check whether you need to investigate certain data points before using more sophisticated methods.
| 180 | 156 | 9 | 176 | 163 | 1827 | 166 | 171 |
You sort the values from low to high and scan for extreme values.
| 9 | 156 | 163 | 166 | 171 | 176 | 180 | 1872 |
Using visualizations
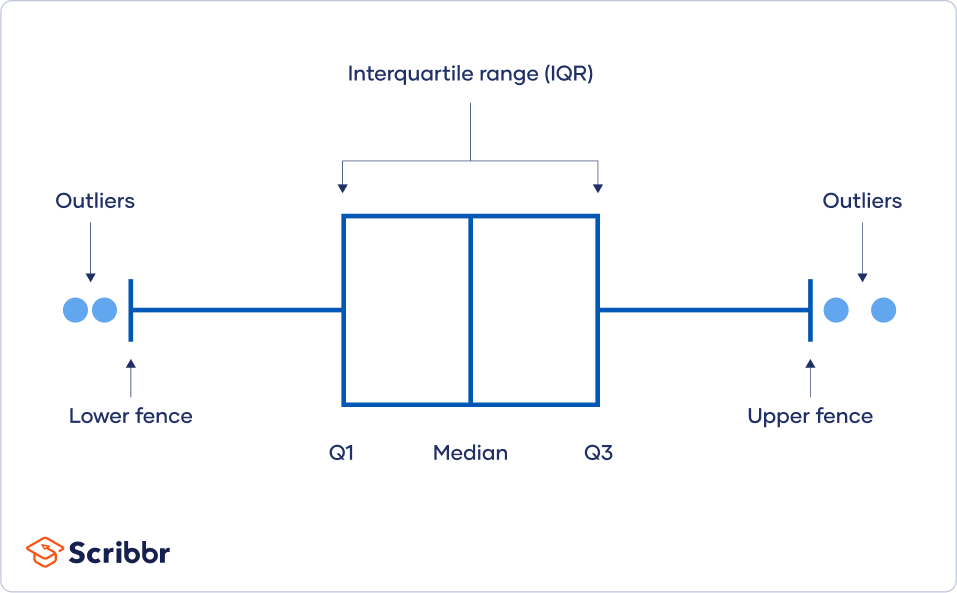
You can use software to visualize your data with a box plot, or a box-and-whisker plot, so you can see the data distribution at a glance. This type of chart highlights minimum and maximum values (the range), the median, and the interquartile range for your data.
Many computer programs highlight an outlier on a chart with an asterisk, and these will lie outside the bounds of the graph.
Statistical outlier detection
Statistical outlier detection involves applying statistical tests or procedures to identify extreme values.
You can convert extreme data points into z scores that tell you how many standard deviations away they are from the mean.
If a value has a high enough or low enough z score, it can be considered an outlier. As a rule of thumb, values with a z score greater than 3 or less than –3 are often determined to be outliers.
Using the interquartile range
The interquartile range (IQR) tells you the range of the middle half of your dataset. You can use the IQR to create “fences” around your data and then define outliers as any values that fall outside those fences.
This method is helpful if you have a few values on the extreme ends of your dataset, but you aren’t sure whether any of them might count as outliers.
Interquartile range method
- Sort your data from low to high
- Identify the first quartile (Q1), the median, and the third quartile (Q3).
- Calculate your IQR = Q3 – Q1
- Calculate your upper fence = Q3 + (1.5 * IQR)
- Calculate your lower fence = Q1 – (1.5 * IQR)
- Use your fences to highlight any outliers, all values that fall outside your fences.
Your outliers are any values greater than your upper fence or less than your lower fence.
Example: Using the interquartile range to find outliers
We’ll walk you through the popular IQR method for identifying outliers using a step-by-step example.
Your dataset has 11 values. You have a couple of extreme values in your dataset, so you’ll use the IQR method to check whether they are outliers.
| 26 | 37 | 24 | 28 | 35 | 22 | 31 | 53 | 41 | 64 | 29 |
Step 1: Sort your data from low to high
First, you’ll simply sort your data in ascending order.
| 22 | 24 | 26 | 28 | 29 | 31 | 35 | 37 | 41 | 53 | 64 |
Step 2: Identify the median, the first quartile (Q1), and the third quartile (Q3)
The median is the value exactly in the middle of your dataset when all values are ordered from low to high.
Since you have 11 values, the median is the 6th value. The median value is 31.
| 22 | 24 | 26 | 28 | 29 | 31 | 35 | 37 | 41 | 53 | 64 |
Next, we’ll use the exclusive method for identifying Q1 and Q3. This means we remove the median from our calculations.
The Q1 is the value in the middle of the first half of your dataset, excluding the median. The first quartile value is 25.
| 22 | 24 | 26 | 28 | 29 |
Your Q3 value is in the middle of the second half of your dataset, excluding the median. The third quartile value is 41.
| 35 | 37 | 41 | 53 | 64 |
Step 3: Calculate your IQR
The IQR is the range of the middle half of your dataset. Subtract Q1 from Q3 to calculate the IQR.
| Formula | Calculation |
| IQR = Q3 – Q1 |
Q1 = 26 Q3 = 41 IQR = 41 – 26 = 15 |
Step 4: Calculate your upper fence
The upper fence is the boundary around the third quartile. It tells you that any values exceeding the upper fence are outliers.
| Formula | Calculation |
| Upper fence = Q3 + (1.5 * IQR) |
Upper fence = 41 + (1.5 * 15) = 41 + 22.5 = 63.5 |
Step 5: Calculate your lower fence
The lower fence is the boundary around the first quartile. Any values less than the lower fence are outliers.
| Formula | Calculation |
| Lower fence = Q1 – (1.5 * IQR) |
Lower fence = 26 – (1.5 * IQR) = 26 – 22.5 = 3.5 |
Step 6: Use your fences to highlight any outliers
Go back to your sorted dataset from Step 1 and highlight any values that are greater than the upper fence or less than your lower fence. These are your outliers.
- Upper fence = 63.5
- Lower fence = 3.5
| 22 | 24 | 26 | 28 | 29 | 31 | 35 | 37 | 41 | 53 | 64 |
You find one outlier, 64, in your dataset.
Dealing with outliers
Once you’ve identified outliers, you’ll decide what to do with them. Your main options are retaining or removing them from your dataset. This is similar to the choice you’re faced with when dealing with missing data.
For each outlier, think about whether it’s a true value or an error before deciding.
- Does the outlier line up with other measurements taken from the same participant?
- Is this data point completely impossible or can it reasonably come from your population?
- What’s the most likely source of the outlier? Is it a natural variation or an error?
In general, you should try to accept outliers as much as possible unless it’s clear that they represent errors or bad data.
Retain outliers
Just like with missing values, the most conservative option is to keep outliers in your dataset. Keeping outliers is usually the better option when you’re not sure if they are errors.
With a large sample, outliers are expected and more likely to occur. But each outlier has less of an effect on your results when your sample is large enough. The central tendency and variability of your data won’t be as affected by a couple of extreme values when you have a large number of values.
If you have a small dataset, you may also want to retain as much data as possible to make sure you have enough statistical power. If your dataset ends up containing many outliers, you may need to use a statistical test that’s more robust to them. Non-parametric statistical tests perform better for these data.
Remove outliers
Outlier removal means deleting extreme values from your dataset before you perform statistical analyses. You aim to delete any dirty data while retaining true extreme values.
It’s a tricky procedure because it’s often impossible to tell the two types apart for sure. Deleting true outliers may lead to a biased dataset and an inaccurate conclusion.
For this reason, you should only remove outliers if you have legitimate reasons for doing so. It’s important to document each outlier you remove and your reasons so that other researchers can follow your procedures.
Other interesting articles
If you want to know more about statistics, methodology, or research bias, make sure to check out some of our other articles with explanations and examples.
Statistics
Methodology
Frequently asked questions about outliers
Cite this Scribbr article
If you want to cite this source, you can copy and paste the citation or click the “Cite this Scribbr article” button to automatically add the citation to our free Citation Generator.
Bhandari, P. (2024, January 17). How to Find Outliers | 4 Ways with Examples & Explanation. Scribbr. Retrieved July 8, 2026, from https://www.scribbr.com/statistics/outliers/
