Chi-Square (Χ²) Table | Examples & Downloadable Table
The chi-square (Χ2) distribution table is a reference table that lists chi-square critical values. A chi-square critical value is a threshold for statistical significance for certain hypothesis tests and defines confidence intervals for certain parameters.
Chi-square critical values are calculated from chi-square distributions. They’re difficult to calculate by hand, which is why most people use a reference table or statistical software instead.
Download chi-square table (PDF)
When to use a chi-square distribution table
You will need a chi-square critical value if you want to:
- Calculate a confidence interval for a population variance or standard deviation
- Test whether the variance or standard deviation of a population is equal to a certain value (test of a single variance)
- Test whether the frequency distribution of a categorical variable is different from your expectations (chi-square goodness of fit test)
- Test whether two categorical variables are related to each other (chi-square test of independence)
- Test whether the proportions of two closely related variables are equal (McNemar’s test)

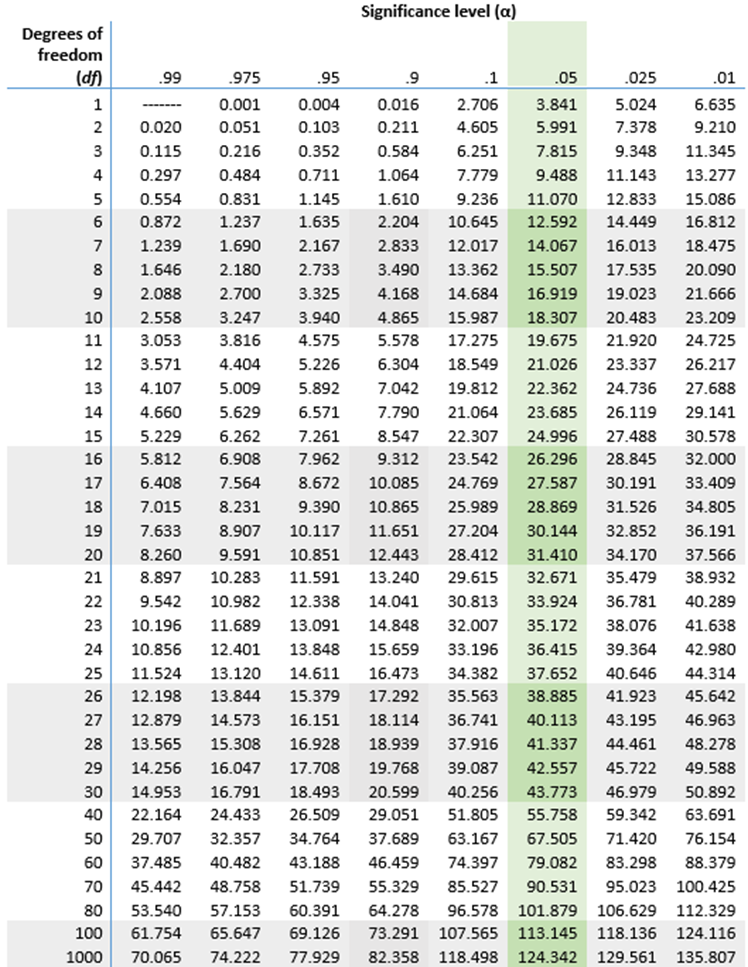
Chi-square distribution table (right-tail probabilities)
Use the table below to find the chi-square critical value for your chi-square test or confidence interval or download the chi-square distribution table (PDF).
The table provides the right-tail probabilities. If you need the left-tail probabilities, you’ll need to make a small additional calculation.
How to use the table
To find the chi-square critical value for your hypothesis test or confidence interval, follow the three steps below.
The team wants to use a chi-square goodness of fit test to test the null hypothesis (H0) that the four entrances are used equally often by the population.
To know whether to reject their null hypothesis, they need to compare the sample’s Pearson’s chi-square to the appropriate chi-square critical value.
Step 1: Calculate the degrees of freedom
There isn’t just one chi-square distribution—there are many, and their shapes differ depending on a parameter called “degrees of freedom” (also referred to as df or k). Each row of the chi-square distribution table represents a chi-square distribution with a different df.
You need to use the distribution with the correct df for your test or confidence interval. The table below gives equations to calculate df for several common procedures:
| Test or procedure | Degrees of freedom (df) equation |
|---|---|
| Test of a single variance
Confidence interval for variance or standard deviation |
df = sample size − 1 |
| Chi-square goodness of fit test | df = number of groups − 1 |
| Chi-square test of independence | df = (number of variable 1 groups − 1) * (number of variable 2 groups − 1) |
| McNemar’s test | df = 1 |
df = number of groups − 1
df = 4 − 1
df = 3
Step 2: Choose a significance level
The columns of the chi-square distribution table indicate the significance level of the critical value. By convention, the significance level (α) is almost always .05, so the column for .05 is highlighted in the table.
In rare situations, you may want to increase α to decrease your Type II error rate or decrease α to decrease your Type I error rate.
To calculate a confidence interval, choose the significance level based on your desired confidence level:
α = 1 − confidence level
The most common confidence level is 95% (.95), which corresponds to α = .05.
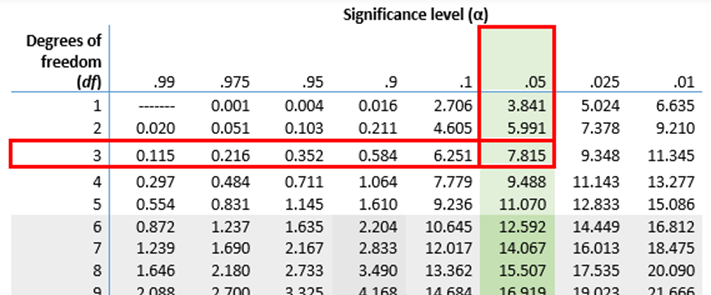
Step 3: Find the critical value in the table
You now have the two numbers you need to find your critical value in the chi-square distribution table:
- The degrees of freedom (df) are listed along the left-hand side of the table. Find the table row corresponding to the degrees of freedom you calculated.
- The significance levels (α) are listed along the top of the table. Find the column corresponding to your chosen significance level.
- The table cell where the row and column meet is your critical value.
The security team can now compare this chi-square critical value to the Pearson’s chi-square they calculated for their sample. If the critical value is larger than the sample’s chi-square, they can reject the null hypothesis.
Left-tailed and two-tailed probabilities
The table provided here gives the right-tail probabilities. You should use this table for most chi-square tests, including the chi-square goodness of fit test and the chi-square test of independence, and McNemar’s test.
If you want to perform a two-tailed or left-tailed test, you’ll need to make a small additional calculation.
Left-tailed tests
The most common left-tailed test is the test of a single variance when determining whether a population’s variance or standard deviation is less than a certain value.
To find the critical value for a left-tailed probability in the table above, simply use the table column for 1 − α.
You pride yourself on making every cookie the same size, so you decide to randomly sample 25 of your cookies to see if their standard deviation is less than 0.2 inches.
This is a left-tailed test because you want to know if the standard deviation is less than a certain value. You look up the left-tailed probability in the right-tailed table by subtracting one from your significance level: 1 − α = 1 − .05 = 0.95.
The critical value for df = 25 − 1 = 24 and α = .95 is 13.848.
If the chi-square of your sample is greater than this critical value, you can reject the null hypothesis that your cookies have a standard deviation of 0.2 inches in diameter.
Two-tailed tests
The most common left-tailed test is the test of a single variance when determining whether a population’s variance or standard deviation is equal to a certain value.
A two-tailed test has two critical values. To find the critical values, use the table columns for  and
and  .
.
They find in a medical textbook that the standard deviation of head diameter of six-month-old babies is 1 inch, but they want to confirm this number themselves. They randomly sample 20 six-month-old babies and measure their heads.
This is a two-tailed test because they want to know if the standard deviation is equal to a certain value. They should look up the two critical values in the columns for:
 and
and
 and
and
The critical value for df = 20 − 1 = 19 and α = .025 is 32.852. The critical value for df = 19 and α = .975 is 8.907.
If the chi-square of their sample is not between these two critical values, the clothing company can reject the null hypothesis that the standard deviation of head diameter is 1 inch.
Practice questions
Other interesting articles
If you want to know more about statistics, methodology, or research bias, make sure to check out some of our other articles with explanations and examples.
Statistics
Methodology
Frequently asked questions about chi-square tables
Cite this Scribbr article
If you want to cite this source, you can copy and paste the citation or click the “Cite this Scribbr article” button to automatically add the citation to our free Citation Generator.
Turney, S. (2023, June 21). Chi-Square (Χ²) Table | Examples & Downloadable Table. Scribbr. Retrieved July 9, 2026, from https://www.scribbr.com/statistics/chi-square-distribution-table/