Quartiles & Quantiles | Calculation, Definition & Interpretation
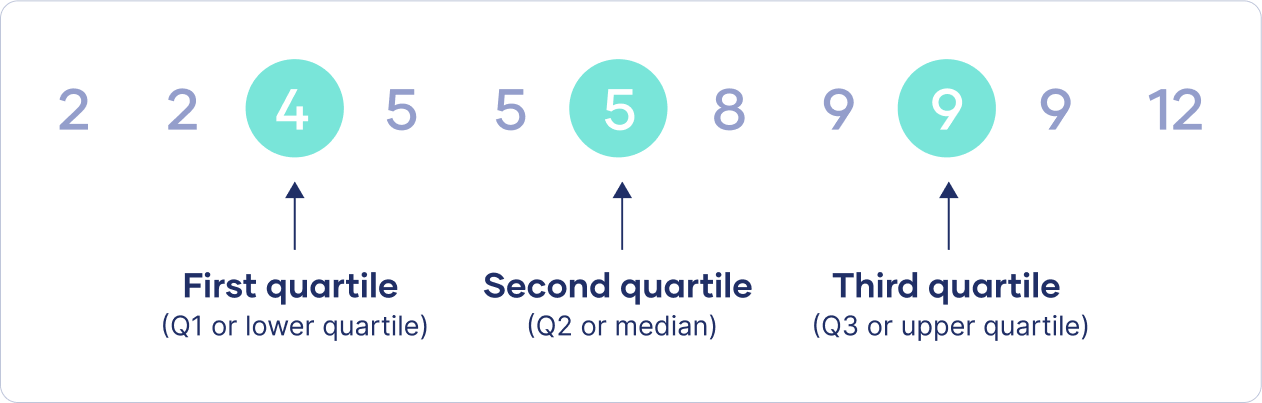
Quartiles are three values that split sorted data into four parts, each with an equal number of observations. Quartiles are a type of quantile.
- First quartile: Also known as Q1, or the lower quartile. This is the number halfway between the lowest number and the middle number.
- Second quartile: Also known as Q2, or the median. This is the middle number halfway between the lowest number and the highest number.
- Third quartile: Also known as Q3, or the upper quartile. This is the number halfway between the middle number and the highest number.
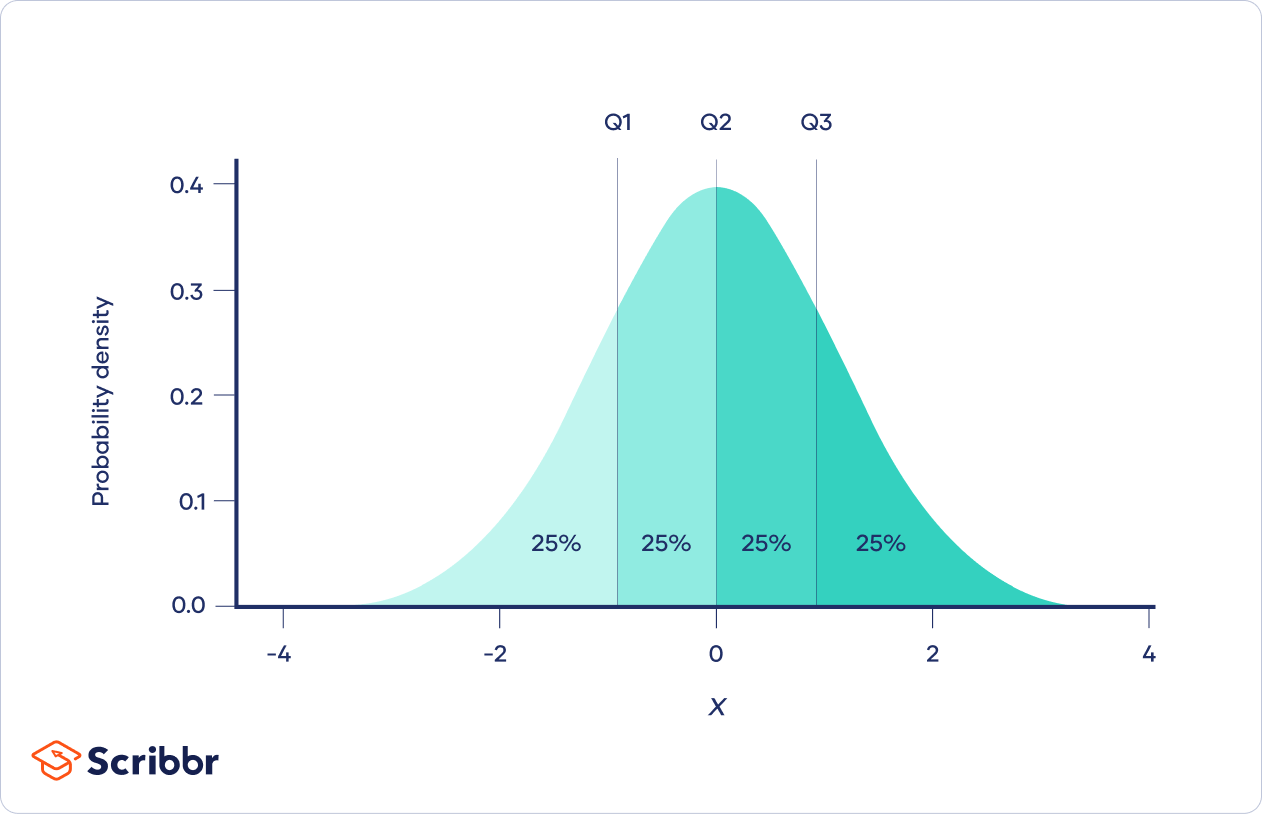
Quartiles can also split probability distributions into four parts, each with an equal probability.
What are quartiles?
Quartiles are a set of descriptive statistics. They summarize the central tendency and variability of a dataset or distribution.
Quartiles are a type of percentile. A percentile is a value with a certain percentage of the data falling below it. In general terms, k% of the data falls below the kth percentile.
- The first quartile (Q1, or the lowest quartile) is the 25th percentile, meaning that 25% of the data falls below the first quartile.
- The second quartile (Q2, or the median) is the 50th percentile, meaning that 50% of the data falls below the second quartile.
- The third quartile (Q3, or the upper quartile) is the 75th percentile, meaning that 75% of the data falls below the third quartile.
By splitting the data at the 25th, 50th, and 75th percentiles, the quartiles divide the data into four equal parts.
- In a sample or dataset, the quartiles divide the data into four groups with equal numbers of observations.
- In a probability distribution, the quartiles divide the distribution’s range into four intervals with equal probability.
Here's why students love Scribbr's proofreading services
How to find quartiles
To find the quartiles of a dataset or sample, follow the step-by-step guide below.
- Count the number of observations in the dataset (n).
- Sort the observations from smallest to largest.
- Find the first quartile:
- Calculate n * (1 / 4).
- If n * (1 / 4) is an integer, then the first quartile is the mean of the numbers at positions n * (1 / 4) and n * (1 / 4) + 1.
- If n * (1 / 4) is not an integer, then round it up. The number at this position is the first quartile.
- Find the second quartile:
- Calculate n * (2 / 4).
- If n * (2 / 4) is an integer, the second quartile is the mean of the numbers at positions n * (2 / 4) and n * (2 / 4) + 1.
- If n * (2 / 4) is not an integer, then round it up. The number at this position is the second quartile.
- Find the third quartile:
- Calculate n * (3 / 4).
- If n * (3 / 4) is an integer, then the third quartile is the mean of the numbers at positions n * (3 / 4) and n * (3 / 4) + 1.
- If n * (3 / 4) is not an integer, then round it up. The number at this position is the third quartile.
There are multiple methods to calculate the first and third quartiles, and they don’t always give the same answers. There’s no universal agreement on the best way to calculate quartiles.
Lower and upper quartile calculator
You can calculate the lower and upper quartile by hand or with the help of our calculator below. You can switch between the lower and upper quartile in the input field. Just type “lower quartile x,y,z” to calculate the lower quartile of your data set, or “upper quartile x,y,z” for the upper quartile of your data set.
Step-by-step example
Imagine you conducted a small study on language development in children 1–6 years old. You’re writing a paper about the study and you want to report the quartiles of the children’s ages.
| Age (years) | 1 | 2 | 3 | 4 | 5 | 6 |
|---|---|---|---|---|---|---|
| Frequency | 2 | 3 | 4 | 1 | 2 | 2 |
1, 1, 2, 2, 2, 3, 3, 3, 3, 4, 5, 5, 6, 6
3.5 is not an integer, so Q1 is the number at position 4.
1, 1, 2, 2, 2, 3, 3, 3, 3, 4, 5, 5, 6, 6
Q1 = 2 years
7 is an integer, so Q2 is the mean of the numbers at positions 7 and 8.
1, 1, 2, 2, 2, 3, 3, 3, 3, 4, 5, 5, 6, 6
Q2 = (3 + 3) / 2
Q2 = 3 years
10.5 is not an integer, so Q3 is the number at position 11.
1, 1, 2, 2, 2, 3, 3, 3, 3, 4, 5, 5, 6, 6
Q3 = 5 years
Here's why students love Scribbr's proofreading services
Visualizing quartiles with boxplots
Boxplots are helpful visual summaries of a dataset. They’re composed of boxes, which show the quartiles, and whiskers, which show the lowest and highest observations.
To make a boxplot, you first need to calculate the five-number summary:
- The minimum
- This is the lowest observation. If you order the numbers in your dataset from lowest to highest, the minimum is the first number. The minimum is sometimes called the zeroth quantile.
- The first quartile
- The second quartile
- The third quartile
- The maximum
- This is the highest observation. If you order the numbers in your dataset from lowest to highest, the maximum is the last number. The maximum is sometimes called the fourth quantile.
With these five numbers, you can draw a boxplot:
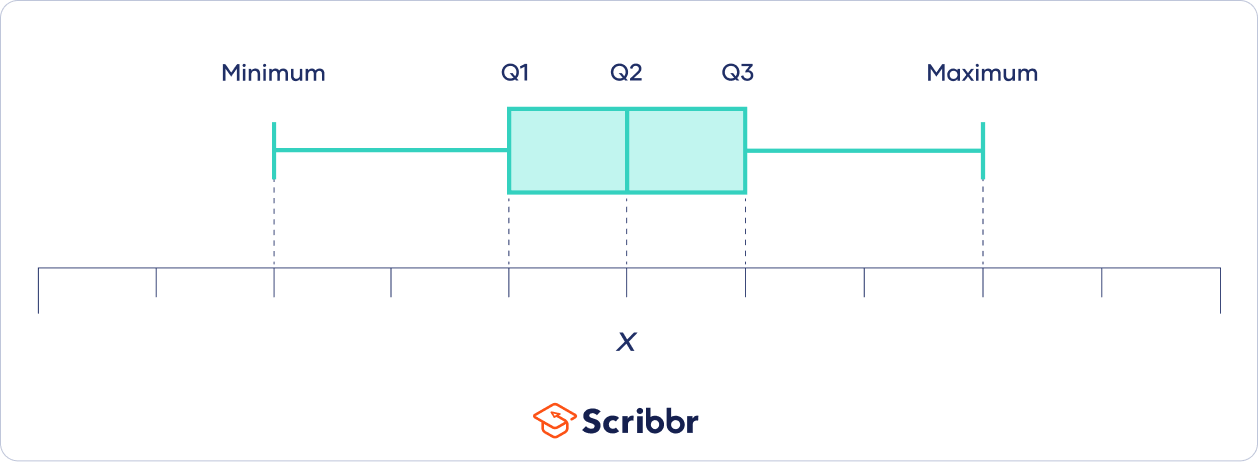
This isn’t the only method of drawing boxplots. Although the box always indicates the quartiles, often the whiskers indicate 1.5 IQR from the Q1 and Q3.
1, 1, 2, 2, 2, 3, 3, 3, 3, 4, 5, 5, 6, 6
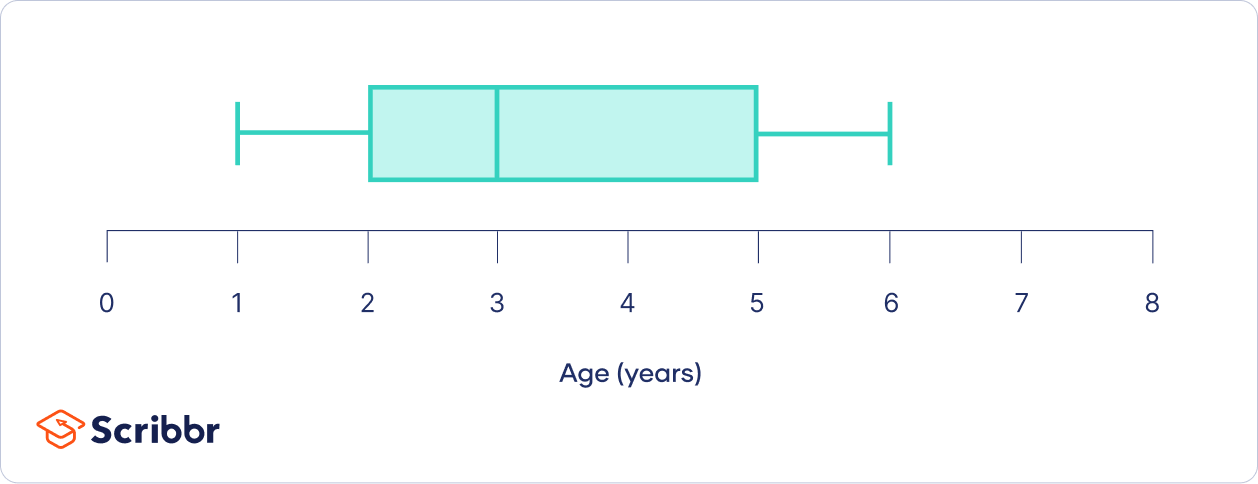
To create a boxplot, the first step is to calculate the five-number summary:
- The minimum: 1 year old
- The first quartile: 2 years old
- The second quartile: 3 years old
- The third quartile: 5 years old
- The maximum: 6 years old
These numbers determine the position of the box and whiskers on a number line:
Interpreting quartiles
Quartiles can give you useful information about an observation or a dataset.
Comparing observations
Quartiles are helpful for understanding an observation in the context of the rest of a sample or population. By comparing the observation to the quartiles, you can determine whether the observation is in the bottom 25%, middle 50%, or top 25%.
Median
The second quartile, better known as the median, is a measure of central tendency. This middle number is a good measure of the average or most central value of the data, especially for skewed distributions or distributions with outliers.
Interquartile range
The distance between the first and third quartiles—the interquartile range (IQR)—is a measure of variability. It indicates the spread of the middle 50% of the data.
The IQR is an especially good measure of variability for skewed distributions or distributions with outliers. IQR only includes the middle 50% of the data, so, unlike the range, the IQR isn’t affected by extreme values.
Skewness
The distance between quartiles can give you a hint about whether a distribution is skewed or symmetrical. It’s easiest to use a boxplot to look at the distances between quartiles:
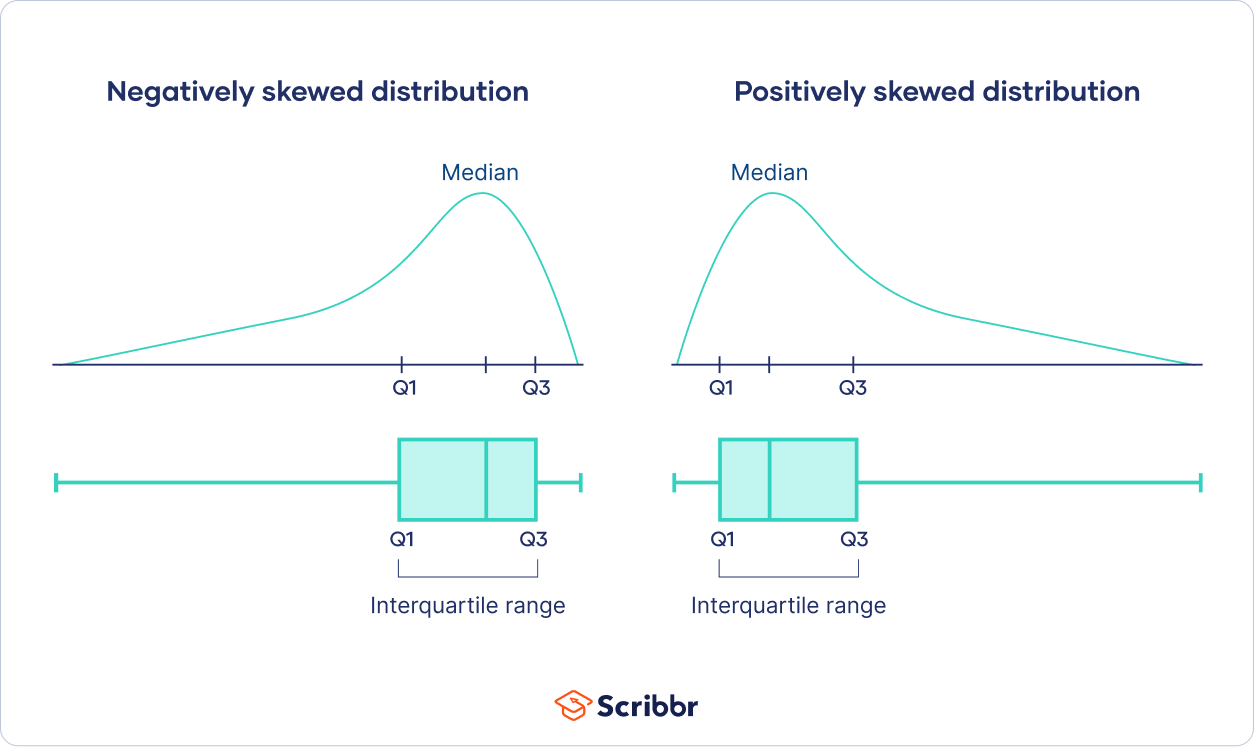
Note that a histogram or skewness measure will give you a more reliable indication of skewness.
Identifying outliers
The interquartile range (IQR) can be used to identify outliers. Outliers are observations that are extremely high or low. One definition of an outlier is any observation that is more than 1.5 IQR away from the first or third quartile.
What are quantiles?
A quartile is a type of quantile.
Quantiles are values that split sorted data or a probability distribution into equal parts. In general terms, a q-quantile divides sorted data into q parts. The most commonly used quantiles have special names:
- Quartiles (4-quantiles): Three quartiles split the data into four parts.
- Deciles (10-quantiles): Nine deciles split the data into 10 parts.
- Percentiles (100-quantiles): 99 percentiles split the data into 100 parts.
There is always one fewer quantile than there are parts created by the quantiles.
How to find quantiles
To find a q-quantile, you can follow a similar method to that used for quartiles, except in steps 3–5, multiply n by multiples of 1/q instead of 1/4.
For example, to find the third 5-quantile:
- Calculate n * (3 / 5).
- If n * (3 / 5) is an integer, then the third 5-quantile is the mean of the numbers at positions n * (3 / 5) and n * (3 / 5) + 1.
- If n * (3 / 5) is not an integer, then round it up. The number at this position is the third 5-quantile.
Practice questions
Other interesting articles
If you want to know more about statistics, methodology, or research bias, make sure to check out some of our other articles with explanations and examples.
Statistics
Methodology
Frequently asked questions about quartiles and quantiles
Cite this Scribbr article
If you want to cite this source, you can copy and paste the citation or click the “Cite this Scribbr article” button to automatically add the citation to our free Citation Generator.
Turney, S. (2023, June 21). Quartiles & Quantiles | Calculation, Definition & Interpretation. Scribbr. Retrieved July 1, 2026, from https://www.scribbr.com/statistics/quartiles-quantiles/