Skewness | Definition, Examples & Formula
Skewness is a measure of the asymmetry of a distribution. A distribution is asymmetrical when its left and right side are not mirror images.
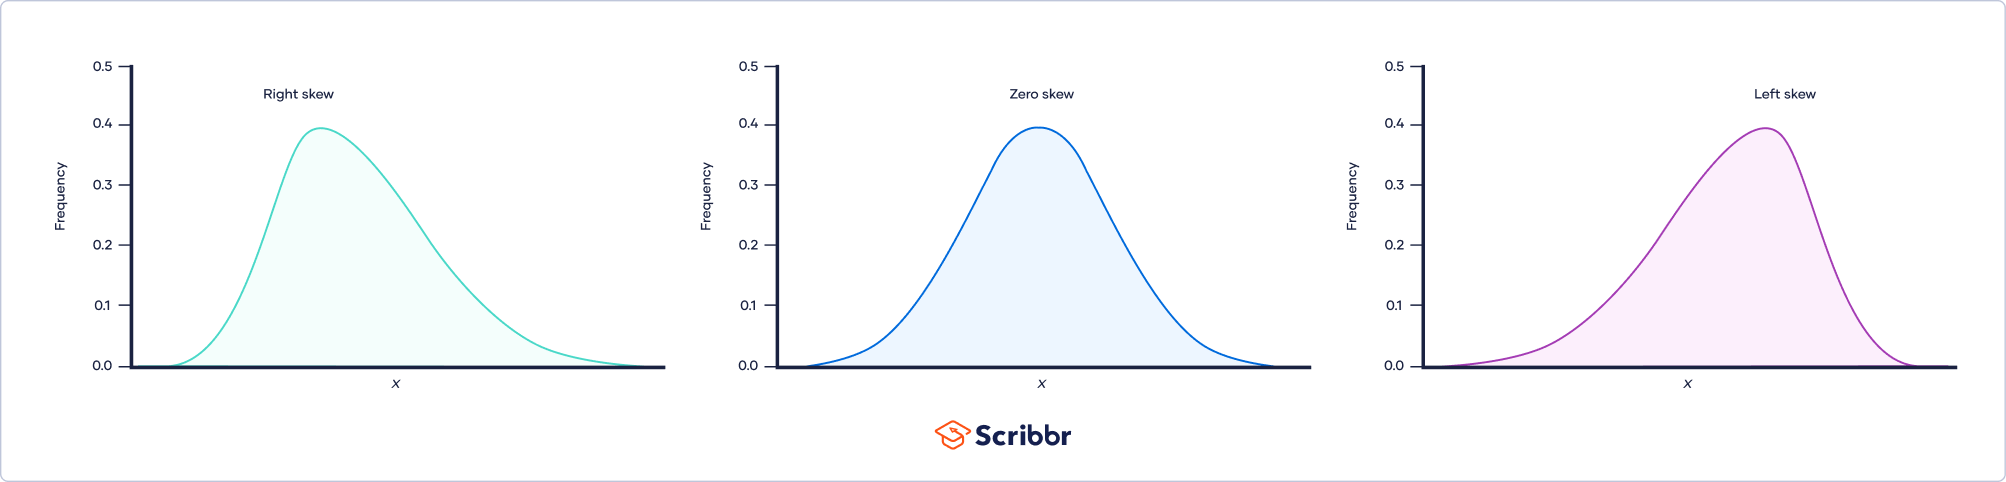
A distribution can have right (or positive), left (or negative), or zero skewness. A right-skewed distribution is longer on the right side of its peak, and a left-skewed distribution is longer on the left side of its peak:
You might want to calculate the skewness of a distribution to:
- Describe the distribution of a variable alongside other descriptive statistics
- Determine if a variable is normally distributed. A normal distribution has zero skew and is an assumption of many statistical procedures.
What is zero skew?
When a distribution has zero skew, it is symmetrical. Its left and right sides are mirror images.
Normal distributions have zero skew, but they’re not the only distributions with zero skew. Any symmetrical distribution, such as a uniform distribution or some bimodal (two-peak) distributions, will also have zero skew.
The easiest way to check if a variable has a skewed distribution is to plot it in a histogram. For example, the weights of six-week-old chicks are shown in the histogram below.
The distribution is approximately symmetrical, with the observations distributed similarly on the left and right sides of its peak. Therefore, the distribution has approximately zero skew.
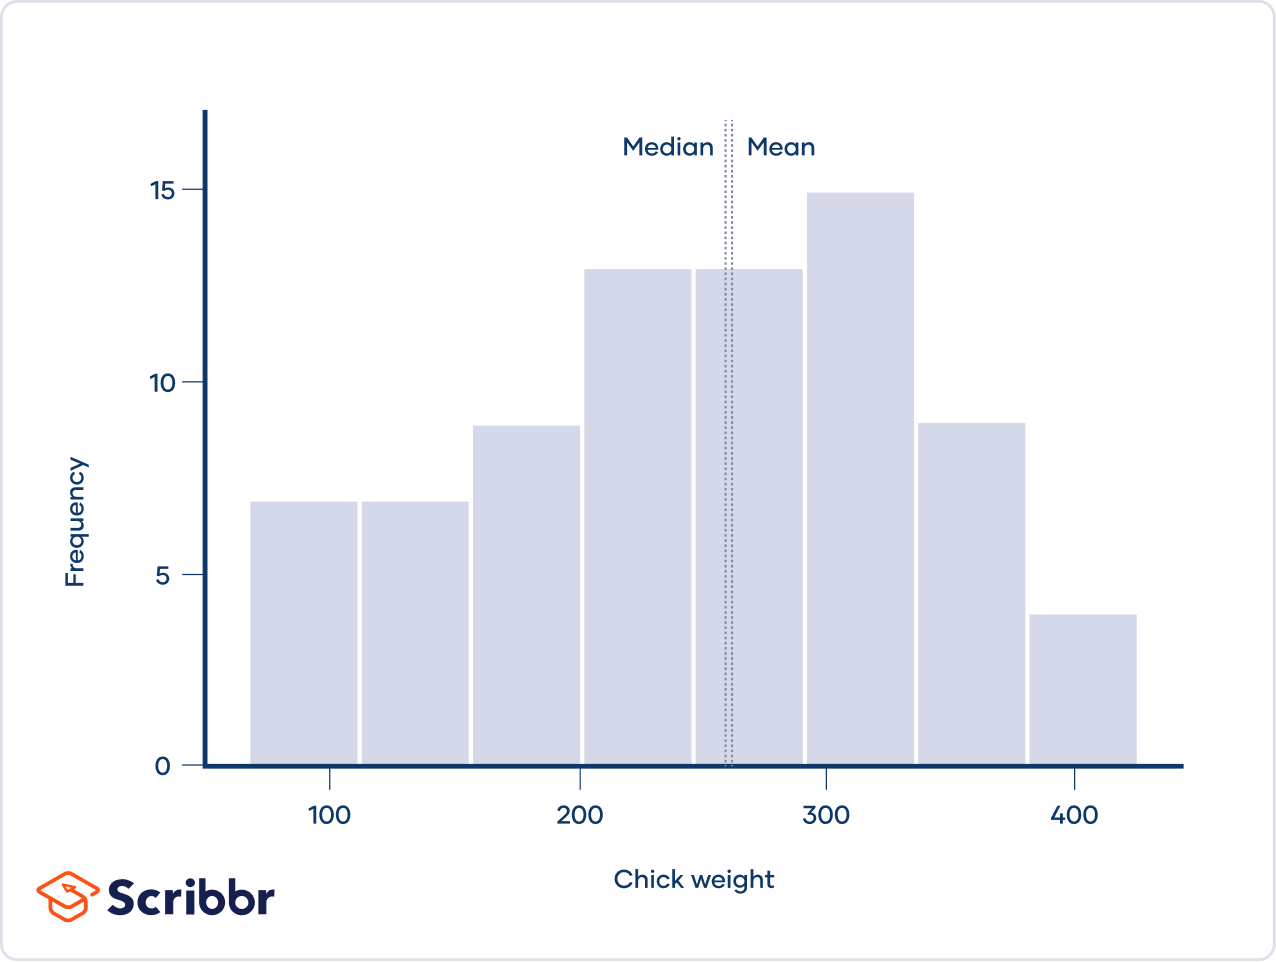
In a distribution with zero skew, the mean and median are equal.
For example, the mean chick weight is 261.3 g, and the median is 258 g. The mean and median are almost equal. They aren’t perfectly equal because the sample distribution has a very small skew.
Although a theoretical distribution (e.g., the z distribution) can have zero skew, real data almost always have at least a bit of skew. However, if a distribution is close to being symmetrical, it usually is considered to have zero skew for practical purposes, such as verifying model assumptions.
Here's why students love Scribbr's proofreading services
What is right skew (positive skew)?
A right-skewed distribution is longer on the right side of its peak than on its left. Right skew is also referred to as positive skew.
You can think of skewness in terms of tails. A tail is a long, tapering end of a distribution. It indicates that there are observations at one of the extreme ends of the distribution, but that they’re relatively infrequent. A right-skewed distribution has a long tail on its right side.
The number of sunspots observed per year, shown in the histogram below, is an example of a right-skewed distribution. The sunspots, which are dark, cooler areas on the surface of the sun, were observed by astronomers between 1749 and 1983.
The distribution is right-skewed because it’s longer on the right side of its peak. There is a long tail on the right, meaning that every few decades there is a year when the number of sunspots observed is a lot higher than average.
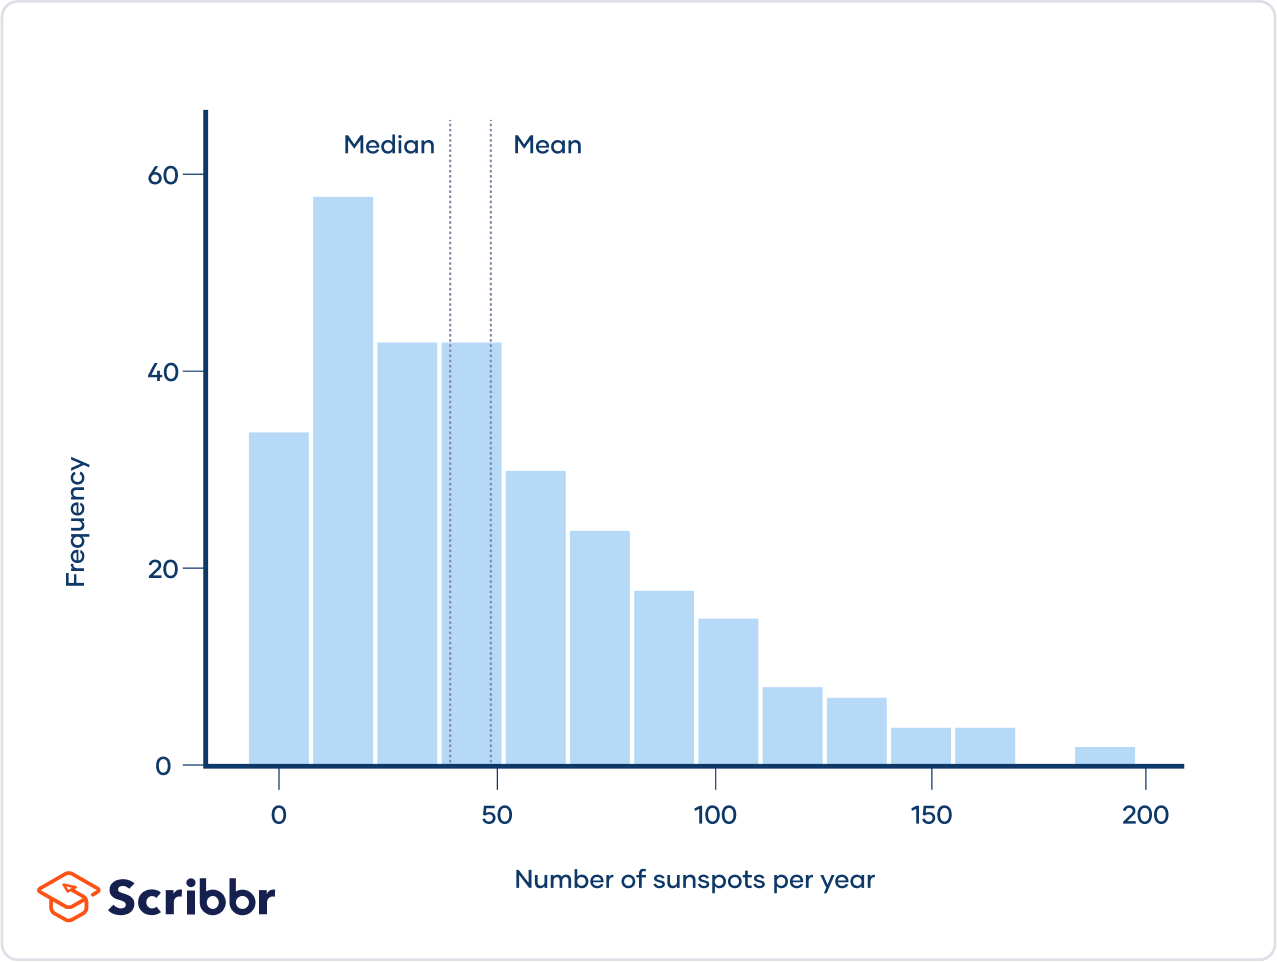
The mean of a right-skewed distribution is almost always greater than its median. That’s because extreme values (the values in the tail) affect the mean more than the median.
For example, the mean number of sunspots observed per year was 48.6, which is greater than the median of 39.
What is left skew (negative skew)?
A left-skewed distribution is longer on the left side of its peak than on its right. In other words, a left-skewed distribution has a long tail on its left side. Left skew is also referred to as negative skew.
Test scores often follow a left-skewed distribution, with most students performing relatively well and a few students performing far below average. The histogram below shows scores for the zoology portion of a standardized test taken by Indian students at the end of high school.
The distribution is left-skewed because it’s longer on the left side of its peak. The long tail on its left represents the small proportion of students who received very low scores.
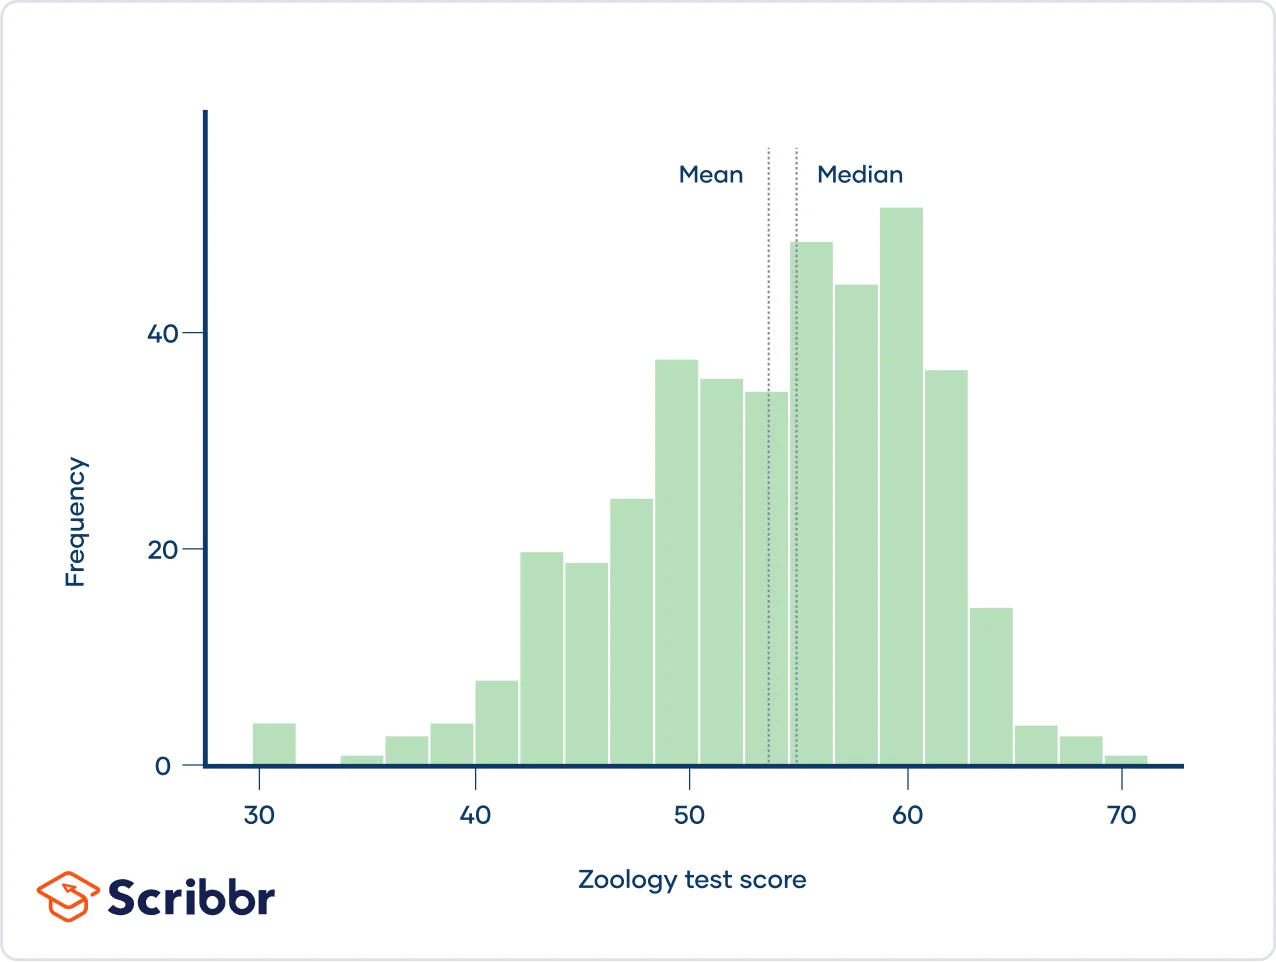
The mean of a left-skewed distribution is almost always less than its median.
For example, the mean zoology test score was 53.7, which is less than the median of 55.
How to calculate skewness
There are several formulas to measure skewness. One of the simplest is Pearson’s median skewness. It takes advantage of the fact that the mean and median are unequal in a skewed distribution.

Pearson’s median skewness tells you how many standard deviations separate the mean and median.
Real observations rarely have a Pearson’s median skewness of exactly 0. If your data has a value close to 0, you can consider it to have zero skew. There’s no standard convention for what counts as “close enough” to 0 (although this research suggests that 0.4 and −0.4 are reasonable cutoffs for large samples).
- Mean = 48.6
- Median = 39
- Standard deviation = 39.5
Calculation
Pearson’s median skewness =
Pearson’s median skewness = 
Pearson’s median skewness = 
What to do if your data is skewed
One reason you might check if a distribution is skewed is to verify whether your data is appropriate for a certain statistical procedure. Many statistical procedures assume that variables or residuals are normally distributed. Skew is a common way that a distribution can differ from a normal distribution.
You generally have three choices if your statistical procedure requires a normal distribution and your data is skewed:
- Do nothing. Many statistical tests, including t tests, ANOVAs, and linear regressions, aren’t very sensitive to skewed data. Especially if the skew is mild or moderate, it may be best to ignore it.
- Use a different model. You may want to choose a model that doesn’t assume a normal distribution. Non-parametric tests or generalized linear models could be more appropriate for your data.
- Transform the variable. Another option is to transform a skewed variable so that it’s less skewed. “Transform” means to apply the same function to all the observations of a variable.
| Type of skew | Intensity of skew | Transformation |
| Right | Mild | Do not transform |
| Moderate | Square root | |
| Strong | Natural log | |
| Very strong | Log base 10 | |
| Left | Mild | Do not transform |
| Moderate | Reflect* then square root | |
| Strong | Reflect* then natural log | |
| Very strong | Reflect* then log base 10 |
*In this context, “reflect” means to take the largest observation, K, then subtract each observation from K + 1. Keep in mind that the reflection reverses the direction of the variable and its relationships with other variables (i.e., positive relationships become negative).
Since the number of sunspots observed per year is right-skewed, you can try to address the issue by transforming the variable. You could also ignore the skew, since linear regression isn’t very sensitive to skew.
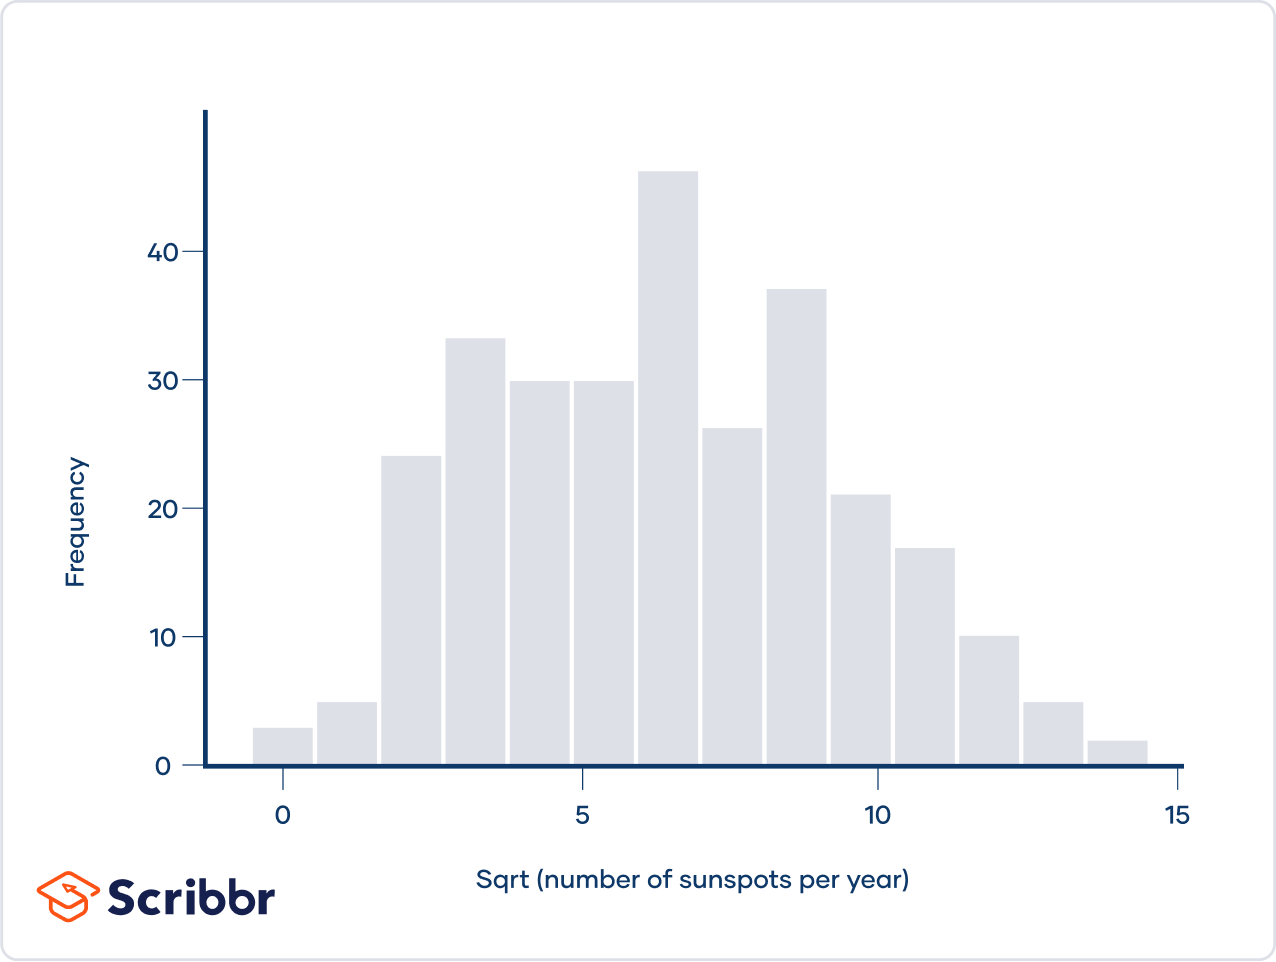
Start with a square root transformation. If that isn’t enough to correct the skew, you can move on to the next transformation option.
| Number of sunspots per year | Sqrt(number of sunspots per year) |
| 5 | 2,236 |
| 11 | 3,317 |
| 16 | 4,000 |
| 23 | 4,796 |
| … | … |
When you plot the transformed variable on a histogram, you can see that it now has close to zero skew. You can replace the number of sunspots per year with the transformed variable in the linear regression. It’s likely that the residuals of the linear regression will now be normally distributed.
Practice questions
Other interesting articles
If you want to know more about statistics, methodology, or research bias, make sure to check out some of our other articles with explanations and examples.
Statistics
Methodology
Frequently asked questions about skewness

Cite this Scribbr article
If you want to cite this source, you can copy and paste the citation or click the “Cite this Scribbr article” button to automatically add the citation to our free Citation Generator.
Turney, S. (2023, November 10). Skewness | Definition, Examples & Formula. Scribbr. Retrieved June 23, 2026, from https://www.scribbr.com/statistics/skewness/