Poisson Distributions | Definition, Formula & Examples
A Poisson distribution is a discrete probability distribution. It gives the probability of an event happening a certain number of times (k) within a given interval of time or space.
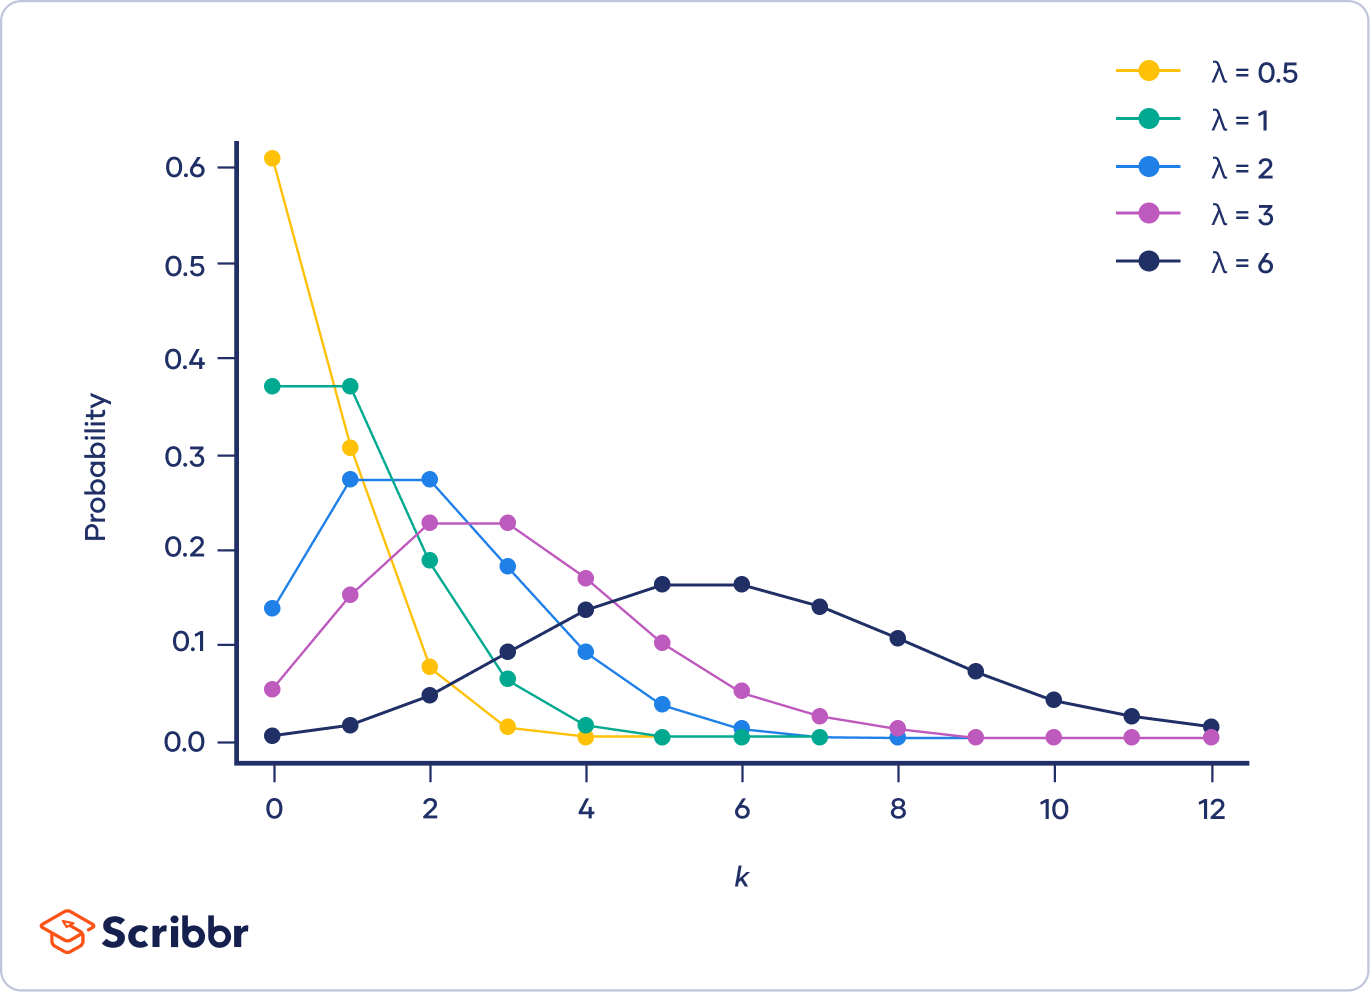
The Poisson distribution has only one parameter, λ (lambda), which is the mean number of events. The graph below shows examples of Poisson distributions with different values of λ.
What is a Poisson distribution?
A Poisson distribution is a discrete probability distribution, meaning that it gives the probability of a discrete (i.e., countable) outcome. For Poisson distributions, the discrete outcome is the number of times an event occurs, represented by k.
You can use a Poisson distribution to predict or explain the number of events occurring within a given interval of time or space. “Events” could be anything from disease cases to customer purchases to meteor strikes. The interval can be any specific amount of time or space, such as 10 days or 5 square inches.
You can use a Poisson distribution if:
- Individual events happen at random and independently. That is, the probability of one event doesn’t affect the probability of another event.
- You know the mean number of events occurring within a given interval of time or space. This number is called λ (lambda), and it is assumed to be constant.
When events follow a Poisson distribution, λ is the only thing you need to know to calculate the probability of an event occurring a certain number of times.
Here's why students love Scribbr's proofreading services
Examples of Poisson distributions
In general, Poisson distributions are often appropriate for count data. Count data is composed of observations that are non-negative integers (i.e., numbers that are used for counting, such as 0, 1, 2, 3, 4, and so on).
Horse kick deaths
One of the first applications of the Poisson distribution was by statistician Ladislaus Bortkiewicz. In the late 1800s, he investigated accidental deaths by horse kick of soldiers in the Prussian army. He analyzed 20 years of data for 10 army corps, equivalent to 200 years of observations of one corps.
The following histogram shows simulated data that are similar to what Bortkiewicz observed:
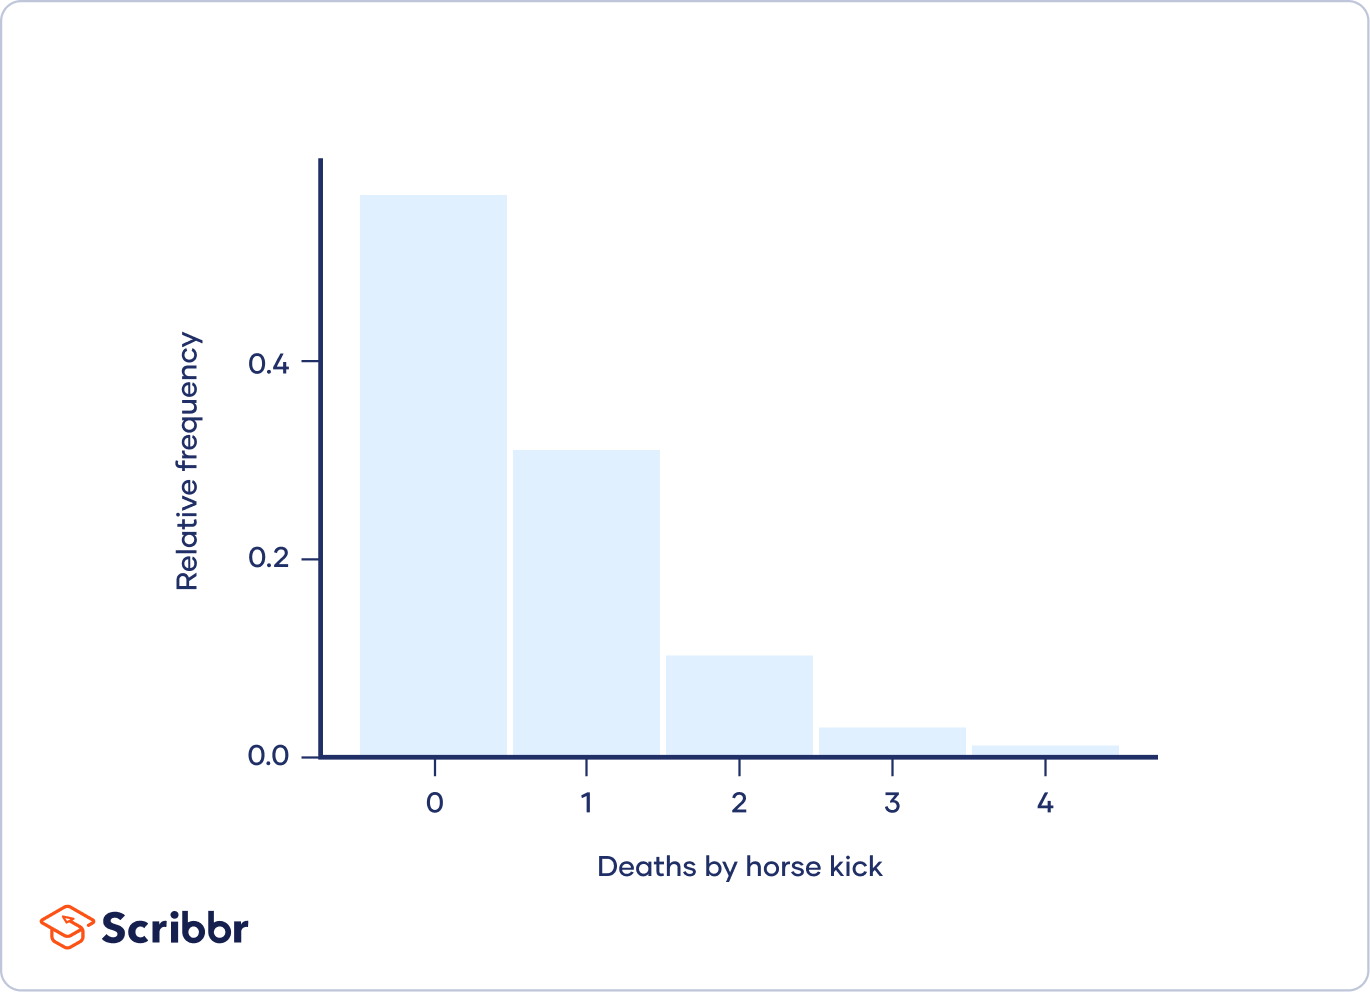
He found that a mean of 0.61 soldiers per corps died from horse kicks each year. However, most years, no soldiers died from horse kicks. On the other end of the spectrum, one tragic year there were four soldiers in the same corps who died from horse kicks.
Using modern terminology:
- A death by horse kick is an “event.”
- The time interval is one year.
- The mean number of events per time interval, λ, is 0.61.
- The number of deaths by horse kick in a specific year is k.
The army corps that Bortkiewicz observed were a sample of the population of all Prussian army corps. Because of the random nature of sampling, samples rarely follow a probability distribution perfectly. The deaths by horse kick in the sample approximately follow a Poisson distribution, so we can reasonably infer that the population follows a Poisson distribution.
Other examples of Poisson distributions
Since Bortkiewicz’s time, Poisson distributions have been used to describe many other things. For example, a Poisson distribution could be used to explain or predict:
- Text messages per hour
- Male grizzly bears per hectare
- Machine malfunctions per year
- Website visitors per month
- Influenza cases per year
Probability mass function graphs
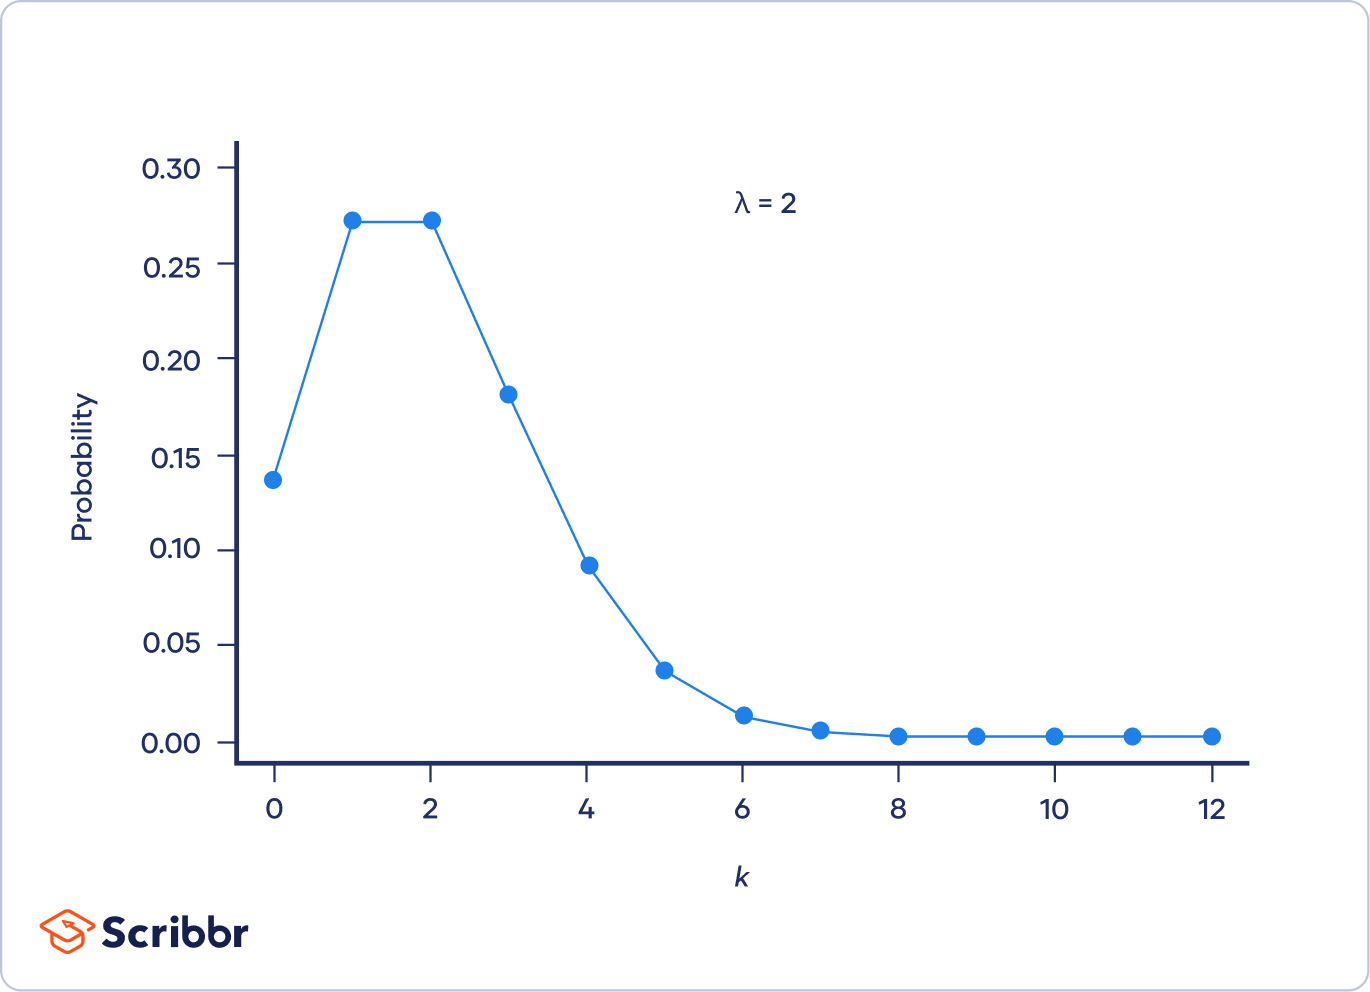
A Poisson distribution can be represented visually as a graph of the probability mass function. A probability mass function is a function that describes a discrete probability distribution.
The most probable number of events is represented by the peak of the distribution—the mode.
- When λ is a non-integer, the mode is the closest integer smaller than λ.
- When λ is an integer, there are two modes: λ and λ−1.
When λ is low, the distribution is much longer on the right side of its peak than its left (i.e., it is strongly right-skewed).
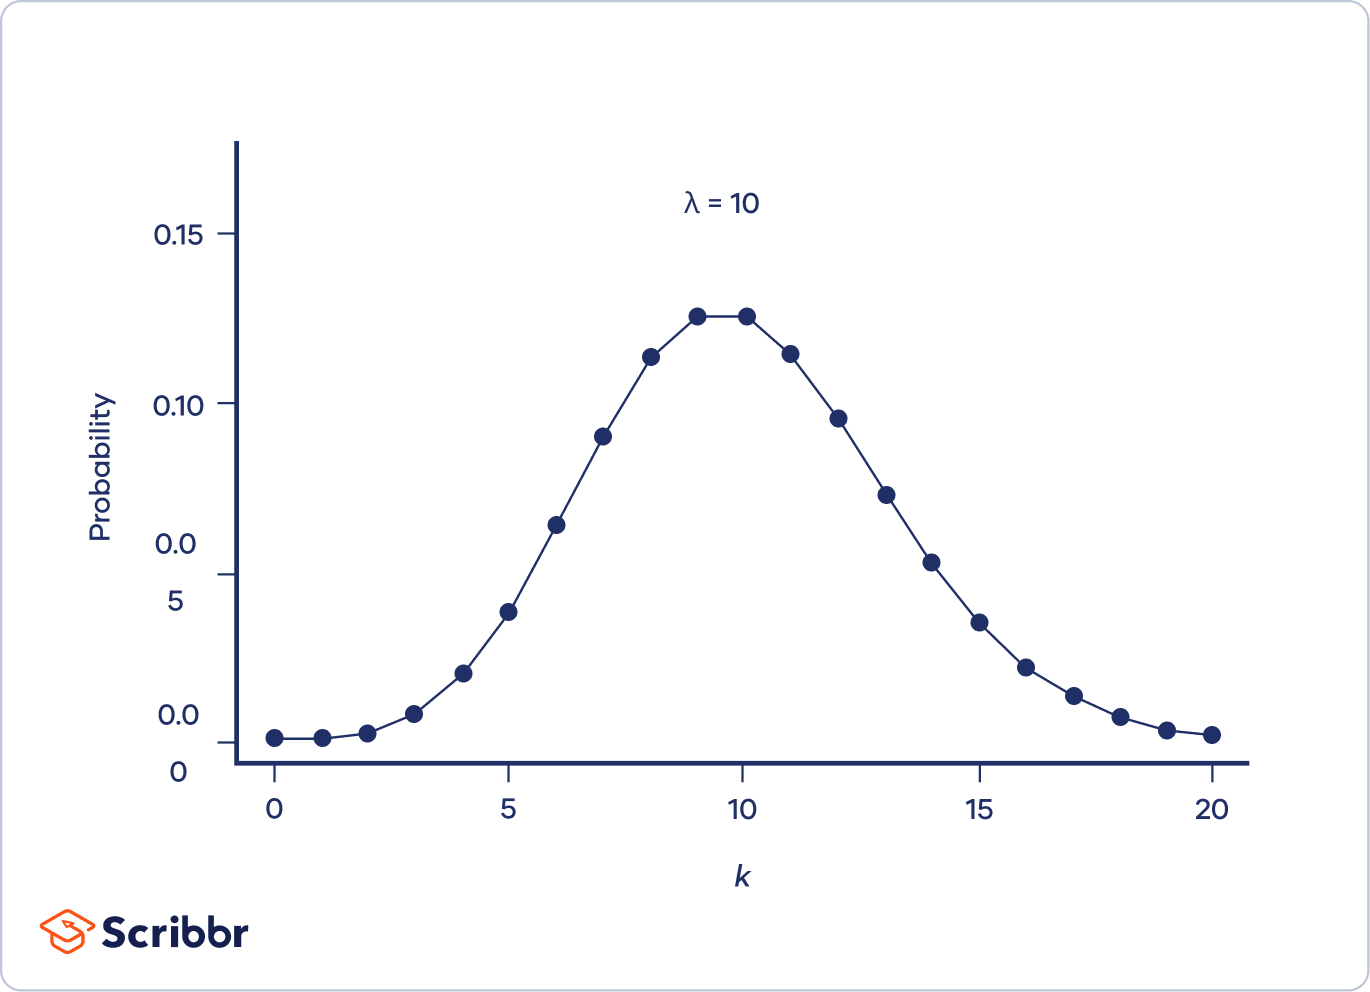
As λ increases, the distribution looks more and more similar to a normal distribution. In fact, when λ is 10 or greater, a normal distribution is a good approximation of the Poisson distribution.
Mean and variance of a Poisson distribution
The Poisson distribution has only one parameter, called λ.
In most distributions, the mean is represented by µ (mu) and the variance is represented by σ² (sigma squared). Because these two parameters are the same in a Poisson distribution, we use the λ symbol to represent both.
Poisson distribution formula
The probability mass function of the Poisson distribution is:

Where:
 is a random variable following a Poisson distribution
 is the number of times an event occurs
 ) is the probability that an event will occur k times
 is Euler’s constant (approximately 2.718)
 is the average number of times an event occurs
- ! is the factorial function
 is a random variable following a Poisson distribution
 ) is the probability that an event will occur k times
Calculation
The specific army corps (VII Army Corps) and year (1898) don’t matter because the probability is constant.
 = 2 deaths by horse kick
 = 0.61 deaths by horse kick per year
 = 2.718


The probability that exactly two soldiers died in the VII Army Corps in 1898 is 0.101.
Practice questions
Other interesting articles
If you want to know more about statistics, methodology, or research bias, make sure to check out some of our other articles with explanations and examples.
Statistics
Methodology
Frequently asked questions about Poisson distributions

Cite this Scribbr article
If you want to cite this source, you can copy and paste the citation or click the “Cite this Scribbr article” button to automatically add the citation to our free Citation Generator.
Turney, S. (2023, June 21). Poisson Distributions | Definition, Formula & Examples. Scribbr. Retrieved July 12, 2026, from https://www.scribbr.com/statistics/poisson-distribution/