How to Find the Median | Definition, Examples & Calculator
The median is the value that’s exactly in the middle of a dataset when it is ordered. It’s a measure of central tendency that separates the lowest 50% from the highest 50% of values.
The steps for finding the median differ depending on whether you have an odd or an even number of data points. If there are two numbers in the middle of a dataset, their mean is the median.
The median is usually used with quantitative data (where the values are numerical), but you can sometimes also find the median for an ordinal dataset (where the values are ranked categories).
Median calculator
You can calculate the median by hand or with the help of our median calculator below.

Find the median with an odd-numbered dataset
We’ll walk through steps using a small sample dataset with the weekly pay of 5 people.
| Weekly pay (USD) | 350 | 800 | 220 | 500 | 130 |
|---|
Step 1: Order the values from low to high.
| Weekly pay (USD) | 130 | 220 | 350 | 500 | 800 |
|---|
Step 2: Calculate the middle position.
Use the formula  , where n is the number of values in your dataset.
| Formula | Calculation |
|---|---|
|
  |
The median is the value at the 3rd position.
Step 3: Find the value in the middle position.
| Weekly pay (USD) | 130 | 220 | 350 | 500 | 800 |
|---|
The median weekly pay is 350 US dollars.
Find the median with an even-numbered dataset
In an even-numbered dataset, there isn’t a single value in the middle of the dataset, so we have to follow a slightly different procedure.
Let’s add another value to the dataset. Now you have 6 values.
| Weekly pay (USD) | 350 | 800 | 220 | 500 | 130 | 1150 |
|---|
Step 1: Order the values from low to high.
| Weekly pay (USD) | 130 | 220 | 350 | 500 | 800 | 1150 |
|---|
Step 2: Calculate the two middle positions.
The middle positions are found using the formulas  and
and  , where n is the number of values in your dataset.
| Formula | Calculation |
|---|---|
|
  |
|
 |
The middle values are at the 3rd and 4th positions.
Step 3: Find the two middle values.
| Weekly pay (USD) | 130 | 220 | 350 | 500 | 800 | 1150 |
|---|
The middle values are 350 and 500.
Step 4: Find the mean of the two middle values.
To find the median, calculate the mean by adding together the middle values and dividing them by two.

The median weekly pay for this dataset is is 425 US dollars.
Find the median with ordinal data
The median is usually used for quantitative data, which means the values in the dataset are numerical. But you can sometimes also identify the median for ordinal data.
Ordinal data is organized into categories with a rank order – for example language ability level (beginner, intermediate, or fluent) or level of agreement (strongly agree, agree, etc.).
The process for finding the median is almost the same.
Odd-numbered dataset
We’ll walk through the steps for an odd-numbered ordinal dataset with 7 values.
You categorize reaction times of participants into 3 groups: slow, medium or fast.
First, order all values in ascending order.
| Reaction speed | Slow | Slow | Medium | Medium | Fast | Fast | Fast |
|---|
Next, find the middle value using , where n is the number of values in the dataset.
| Formula | Calculation |
|---|---|
|
  |
The median is the value at the 4th position.
| Reaction speed | Slow | Slow | Medium | Medium | Fast | Fast | Fast |
|---|
The median reaction speed is Medium.
Can you find the median for an even-numbered ordinal dataset?
The mean cannot be calculated for ordinal data, so the median can’t be found for an even-numbered dataset.
For example, if the two middle values are “slow” and “medium,” you can’t calculate the mean of these values.
In practice, ordinal data is sometimes converted into a numerical format and treated like quantitative data for the sake of convenience. Then the mean of the middle values can be calculated to find the median.
While this is considered acceptable in some contexts, it is not always seen as correct.
When should you use the median?
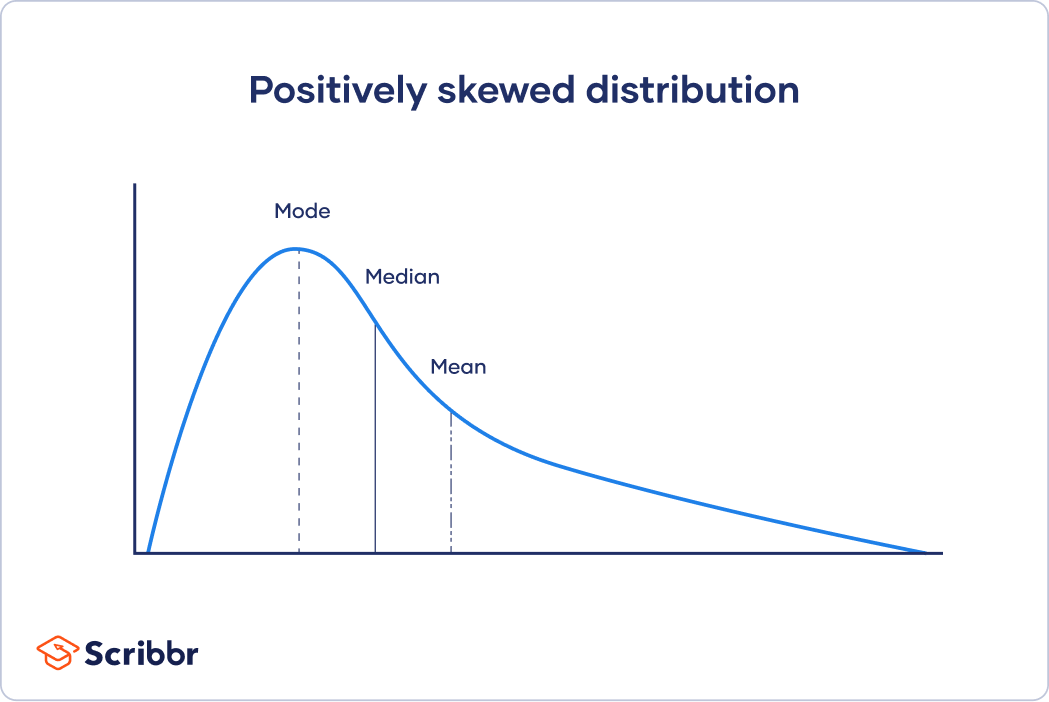
The median is the most informative measure of central tendency for skewed distributions or distributions with outliers.
In skewed distributions, more values fall on one side of the center than the other, and the mean, median and mode all differ from each other.
In a positively skewed distribution, there’s a cluster of lower scores and a spread out tail on the right.
In a negatively skewed distribution, there’s a cluster of higher scores and a spread out tail on the left.
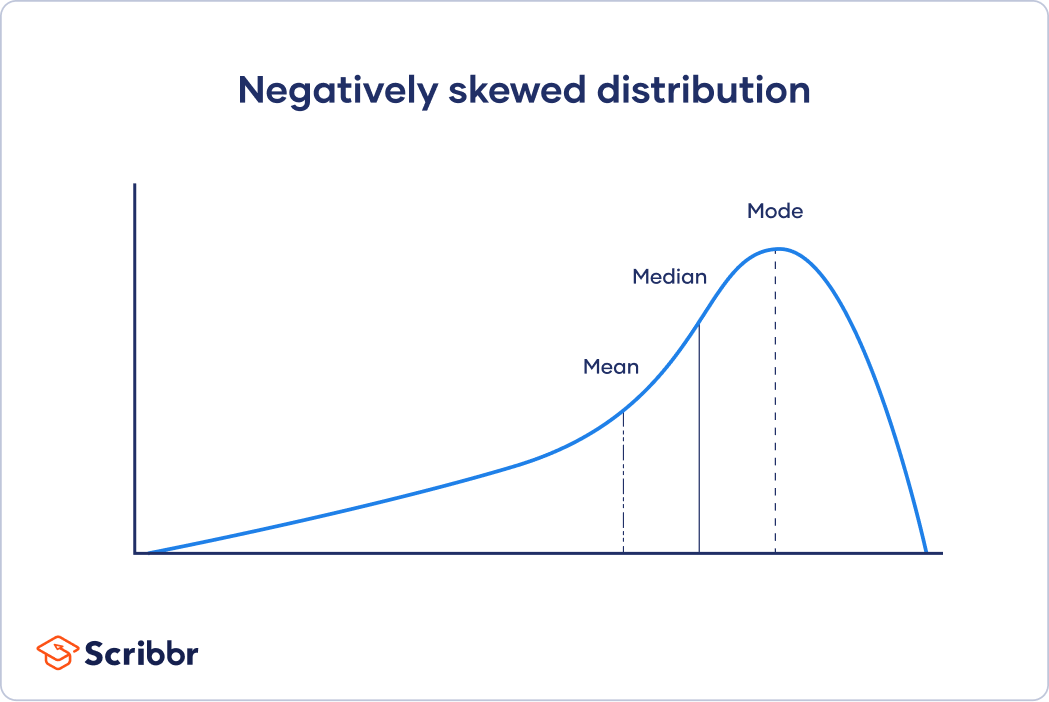
Because the median only uses one or two values from the middle of a dataset, it’s unaffected by extreme outliers or non-symmetric distributions of scores. In contrast, the positions of the mean and mode can vary in skewed distributions.
For this reason, the median is often reported as a measure of central tendency for variables such as income, because these distributions are usually positively skewed.
The level of measurement of your variable also determines whether you can use the median. The median can only be used on data that can be ordered – that is, from ordinal, interval and ratio levels of measurement.
Other interesting articles
If you want to know more about statistics, methodology, or research bias, make sure to check out some of our other articles with explanations and examples.
Statistics
Methodology
Frequently asked questions about the median
Cite this Scribbr article
If you want to cite this source, you can copy and paste the citation or click the “Cite this Scribbr article” button to automatically add the citation to our free Citation Generator.
Bhandari, P. (2023, June 21). How to Find the Median | Definition, Examples & Calculator. Scribbr. Retrieved July 1, 2026, from https://www.scribbr.com/statistics/median/
