An Introduction to t Tests | Definitions, Formula and Examples
A t test is a statistical test that is used to compare the means of two groups. It is often used in hypothesis testing to determine whether a process or treatment actually has an effect on the population of interest, or whether two groups are different from one another.
- The null hypothesis (H0) is that the true difference between these group means is zero.
- The alternate hypothesis (Ha) is that the true difference is different from zero.
When to use a t test
A t test can only be used when comparing the means of two groups (a.k.a. pairwise comparison). If you want to compare more than two groups, or if you want to do multiple pairwise comparisons, use an ANOVA test or a post-hoc test.
The t test is a parametric test of difference, meaning that it makes the same assumptions about your data as other parametric tests. The t test assumes your data:
- are independent
- are (approximately) normally distributed
- have a similar amount of variance within each group being compared (a.k.a. homogeneity of variance)
If your data do not fit these assumptions, you can try a nonparametric alternative to the t test, such as the Wilcoxon Signed-Rank test for data with unequal variances.
What type of t test should I use?
When choosing a t test, you will need to consider two things: whether the groups being compared come from a single population or two different populations, and whether you want to test the difference in a specific direction.

One-sample, two-sample, or paired t test?
- If the groups come from a single population (e.g., measuring before and after an experimental treatment), perform a paired t test. This is a within-subjects design.
- If the groups come from two different populations (e.g., two different species, or people from two separate cities), perform a two-sample t test (a.k.a. independent t test). This is a between-subjects design.
- If there is one group being compared against a standard value (e.g., comparing the acidity of a liquid to a neutral pH of 7), perform a one-sample t test.
One-tailed or two-tailed t test?
- If you only care whether the two populations are different from one another, perform a two-tailed t test.
- If you want to know whether one population mean is greater than or less than the other, perform a one-tailed t test.
- Your observations come from two separate populations (separate species), so you perform a two-sample t test.
- You don’t care about the direction of the difference, only whether there is a difference, so you choose to use a two-tailed t test.
Performing a t test
The t test estimates the true difference between two group means using the ratio of the difference in group means over the pooled standard error of both groups. You can calculate it manually using a formula, or use statistical analysis software.
T test formula
The formula for the two-sample t test (a.k.a. the Student’s t-test) is shown below.

In this formula, t is the t value, x1 and x2 are the means of the two groups being compared, s2 is the pooled standard error of the two groups, and n1 and n2 are the number of observations in each of the groups.
A larger t value shows that the difference between group means is greater than the pooled standard error, indicating a more significant difference between the groups.
You can compare your calculated t value against the values in a critical value chart (e.g., Student’s t table) to determine whether your t value is greater than what would be expected by chance. If so, you can reject the null hypothesis and conclude that the two groups are in fact different.
T test function in statistical software
Most statistical software (R, SPSS, etc.) includes a t test function. This built-in function will take your raw data and calculate the t value. It will then compare it to the critical value, and calculate a p-value. This way you can quickly see whether your groups are statistically different.
In your comparison of flower petal lengths, you decide to perform your t test using R. The code looks like this:
Download the data set to practice by yourself.
Interpreting test results
If you perform the t test for your flower hypothesis in R, you will receive the following output:
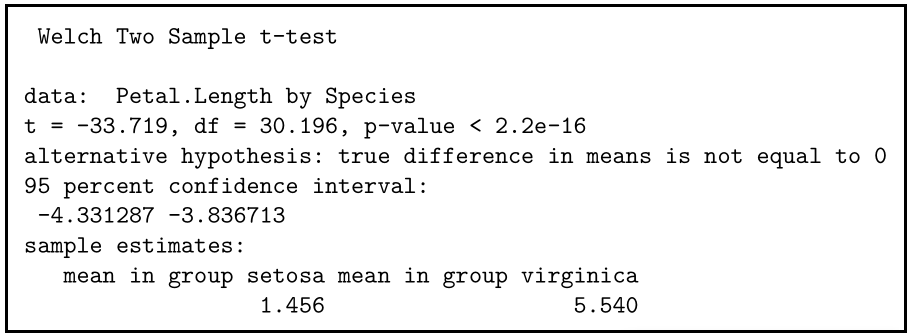
The output provides:
- An explanation of what is being compared, called data in the output table.
- The t value: -33.719. Note that it’s negative; this is fine! In most cases, we only care about the absolute value of the difference, or the distance from 0. It doesn’t matter which direction.
- The degrees of freedom: 30.196. Degrees of freedom is related to your sample size, and shows how many ‘free’ data points are available in your test for making comparisons. The greater the degrees of freedom, the better your statistical test will work.
- The p value: 2.2e-16 (i.e. 2.2 with 15 zeros in front). This describes the probability that you would see a t value as large as this one by chance.
- A statement of the alternative hypothesis (Ha). In this test, the Ha is that the difference is not 0.
- The 95% confidence interval. This is the range of numbers within which the true difference in means will be 95% of the time. This can be changed from 95% if you want a larger or smaller interval, but 95% is very commonly used.
- The mean petal length for each group.
Presenting the results of a t test
When reporting your t test results, the most important values to include are the t value, the p value, and the degrees of freedom for the test. These will communicate to your audience whether the difference between the two groups is statistically significant (a.k.a. that it is unlikely to have happened by chance).
You can also include the summary statistics for the groups being compared, namely the mean and standard deviation. In R, the code for calculating the mean and the standard deviation from the data looks like this:
flower.data %>%
group_by(Species) %>%
summarize(mean_length = mean(Petal.Length),
sd_length = sd(Petal.Length))
In our example, you would report the results like this:
Other interesting articles
If you want to know more about statistics, methodology, or research bias, make sure to check out some of our other articles with explanations and examples.
Statistics
Methodology
Frequently asked questions about t tests
Cite this Scribbr article
If you want to cite this source, you can copy and paste the citation or click the “Cite this Scribbr article” button to automatically add the citation to our free Citation Generator.
Bevans, R. (2023, June 22). An Introduction to t Tests | Definitions, Formula and Examples. Scribbr. Retrieved July 9, 2026, from https://www.scribbr.com/statistics/t-test/
