Akaike Information Criterion | When & How to Use It (Example)
The Akaike information criterion (AIC) is a mathematical method for evaluating how well a model fits the data it was generated from. In statistics, AIC is used to compare different possible models and determine which one is the best fit for the data. AIC is calculated from:
- the number of independent variables used to build the model.
- the maximum likelihood estimate of the model (how well the model reproduces the data).
The best-fit model according to AIC is the one that explains the greatest amount of variation using the fewest possible independent variables.
To find out which of these variables are important for predicting the relationship between sugar-sweetened beverage consumption and body weight, you create several possible models and compare them using AIC.
When to use AIC
In statistics, AIC is most often used for model selection. By calculating and comparing the AIC scores of several possible models, you can choose the one that is the best fit for the data.
When testing a hypothesis, you might gather data on variables that you aren’t certain about, especially if you are exploring a new idea. You want to know which of the independent variables you have measured explain the variation in your dependent variable.
A good way to find out is to create a set of models, each containing a different combination of the independent variables you have measured. These combinations should be based on:
- Your knowledge of the study system – avoid using parameters that are not logically connected, since you can find spurious correlations between almost anything!
- Your experimental design – for example, if you have split two treatments up among test subjects, then there is probably no reason to test for an interaction between the two treatments.
Once you’ve created several possible models, you can use AIC to compare them. Lower AIC scores are better, and AIC penalizes models that use more parameters. So if two models explain the same amount of variation, the one with fewer parameters will have a lower AIC score and will be the better-fit model.
- Final test score in response to hours spent studying
- Final test score in response to hours spent studying + test format
You find an r2 of 0.45 with a p value less than 0.05 for model 1, and an r2 of 0.46 with a p value less than 0.05 for model 2. Model 2 fits the data slightly better – but was it worth it to add another parameter just to get this small increase in model fit?
You run an AIC test to find out, which shows that model 1 has the lower AIC score because it requires less information to predict with almost the exact same level of precision. Another way to think of this is that the increased precision in model 2 could have happened by chance.
From the AIC test, you decide that model 1 is the best model for your study.
How to compare models using AIC
AIC determines the relative information value of the model using the maximum likelihood estimate and the number of parameters (independent variables) in the model. The formula for AIC is:

K is the number of independent variables used and L is the log-likelihood estimate (a.k.a. the likelihood that the model could have produced your observed y-values). The default K is always 2, so if your model uses one independent variable your K will be 3, if it uses two independent variables your K will be 4, and so on.
To compare models using AIC, you need to calculate the AIC of each model. If a model is more than 2 AIC units lower than another, then it is considered significantly better than that model.
You can easily calculate AIC by hand if you have the log-likelihood of your model, but calculating log-likelihood is complicated! Most statistical software will include a function for calculating AIC. We will use R to run our AIC analysis.
AIC in R
To compare several models, you can first create the full set of models you want to compare and then run aictab() on the set.
For the sugar-sweetened beverage data, we’ll create a set of models that include the three predictor variables (age, sex, and beverage consumption) in various combinations. Download the dataset and run the lines of code in R to try it yourself.
Create the models
First, we can test how each variable performs separately.
age.mod <- lm(bmi ~ age, data = bmi.data)

sex.mod <- lm(bmi ~ sex, data = bmi.data)

consumption.mod <- lm(bmi ~ consumption, data = bmi.data)
Next, we want to know if the combination of age and sex are better at describing variation in BMI on their own, without including beverage consumption.
age.sex.mod <- lm(bmi ~ age + sex, data = bmi.data)We also want to know whether the combination of age, sex, and beverage consumption is better at describing the variation in BMI than any of the previous models.
combination.mod <- lm(bmi ~ age + sex + consumption, data = bmi.data)Finally, we can check whether the interaction of age, sex, and beverage consumption can explain BMI better than any of the previous models.
interaction.mod <- lm(bmi ~ age*sex*consumption, data = bmi.data)Compare the models
To compare these models and find which one is the best fit for the data, you can put them together into a list and use the aictab() command to compare all of them at once. To use aictab(), first load the library AICcmodavg.
install.packages("AICcmodavg")
library(AICcmodavg)
Then put the models into a list (‘models’) and name (label) each of them so the AIC table is easier to read (‘model.names’).
models <- list(age.mod, sex.mod, consumption.mod, age.sex.mod, combination.mod, interaction.mod)

model.names <- c('age.mod', 'sex.mod', 'consumption.mod', 'age.sex.mod', 'combination.mod', 'interaction.mod')
Finally, run aictab() to do the comparison.
aictab(cand.set = models, modnames = model.names)Interpreting the results
The code above will produce the following output table:
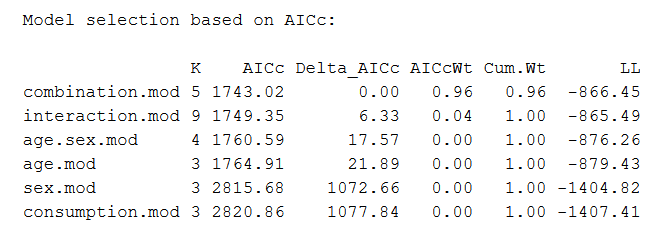
The best-fit model is always listed first. The model selection table includes information on:
- K: The number of parameters in the model. The default K is 2, so a model with one parameter will have a K of 2 + 1 = 3.
- AICc: The information score of the model (the lower-case ‘c’ indicates that the value has been calculated from the AIC test corrected for small sample sizes). The smaller the AIC value, the better the model fit.
- Delta_AICc: The difference in AIC score between the best model and the model being compared. In this table, the next-best model has a delta-AIC of 6.33 compared with the top model, and the third-best model has a delta-AIC of 17.57 compared with the top model.
- AICcWt: AICc weight, which is the proportion of the total amount of predictive power provided by the full set of models contained in the model being assessed. In this case, the top model contains 96% of the total explanation that can be found in the full set of models.
- Cum.Wt: The sum of the AICc weights. Here the top two models contain 100% of the cumulative AICc weight.
- LL: Log-likelihood. This is the value describing how likely the model is, given the data. The AIC score is calculated from the LL and K.
From this table we can see that the best model is the combination model – the model that includes every parameter but no interactions (bmi ~ age + sex + consumption).
The model is much better than all the others, as it carries 96% of the cumulative model weight and has the lowest AIC score. The next-best model is more than 2 AIC units higher than the best model (6.33 units) and carries only 4% of the cumulative model weight.
Based on this comparison, we would choose the combination model to use in our data analysis.

Reporting the results
If you are using AIC model selection in your research, you can state this in your methods section of your thesis, dissertation, or research paper. Report that you used AIC model selection, briefly explain the best-fit model you found, and state the AIC weight of the model.
After finding the best-fit model you can go ahead and run the model and evaluate the results. The output of your model evaluation can be reported in the results section of your paper.
Other interesting articles
If you want to know more about statistics, methodology, or research bias, make sure to check out some of our other articles with explanations and examples.
Statistics
Methodology
Frequently asked questions about AIC
Cite this Scribbr article
If you want to cite this source, you can copy and paste the citation or click the “Cite this Scribbr article” button to automatically add the citation to our free Citation Generator.
Bevans, R. (2023, June 22). Akaike Information Criterion | When & How to Use It (Example). Scribbr. Retrieved July 1, 2026, from https://www.scribbr.com/statistics/akaike-information-criterion/
