Ratio Scales | Definition, Examples, & Data Analysis
A ratio scale is a quantitative scale where there is a true zero and equal intervals between neighboring points. Unlike on an interval scale, a zero on a ratio scale means there is a total absence of the variable you are measuring.
Length, area, and population are examples of ratio scales.
Levels of measurement
The ratio level is the highest of four hierarchical levels of measurement. The levels, or scales, of measurement indicate how precisely data is recorded. The higher the level, the more complex the measurement is.
The ratio level contains all of the features of the other 3 levels. At the ratio level, values can be categorized, ordered, have equal intervals and take on a true zero.
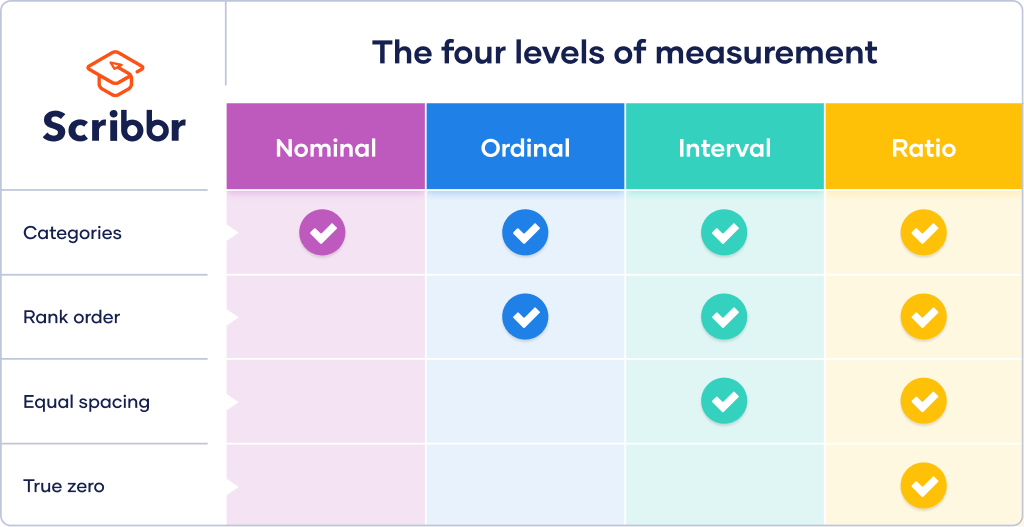
While nominal and ordinal variables are categorical variables, interval and ratio variables are quantitative variables. Many more statistical tests can be performed on quantitative than categorical data.
What is a true zero?
On a ratio scale, a zero means there’s a total absence of the variable of interest. For example, the number of children in a household or years of work experience are ratio variables: A respondent can have no children in their household or zero years of work experience.
With a true zero in your scale, you can calculate ratios of values. For example, you can say that 4 children is twice as many as 2 children in a household. Similarly, 8 years is double 4 years of experience.
Some variables, such as temperature, can be measured on different scales. While Celsius and Fahrenheit are interval scales, Kelvin is a ratio scale.
In all 3 scales, there are equal intervals between neighboring points. However, unlike the Celsius and Fahrenheit scales where zero is just another temperature value, the Kelvin scale has a true zero (0 K) where nothing can be colder.
That means that you can only calculate ratios of temperatures in the Kelvin scale. Although 40° is twice as many degrees as 20°, it isn’t twice as hot on the Celsius or Fahrenheit scales. However, in the Kelvin scale, 40 K is twice as hot as 20 K because there is a true zero at the starting point of this scale.
A true zero makes it possible to multiply, divide or square root values. Collecting data on a ratio level is always preferable to the other levels because it is the most precise.

Examples of ratio scales
Many variables in the natural and social sciences are measured using ratio scales.
Like interval variables, ratio variables can be discrete or continuous.
A discrete variable is expressed only in countable numbers (e.g., integers) while a continuous variable can potentially take on an infinite number of values.
| Ratio variable | Discrete or continuous? |
|---|---|
| Number of vehicles owned in the last 10 years | Discrete |
| Number of people in a household | Discrete |
| Number of students who identify as religious | Discrete |
| Reaction time in a computer task | Continuous |
| Years of work experience | Continuous |
| Speed in miles per hour | Continuous |
Ratio data analysis
After you’ve collected ratio data, you can gather descriptive and inferential statistics. Almost all statistical tests can be performed on ratio data because all mathematical operations are permissible.
To summarize your data, you can collect the following descriptive statistics:
- the frequency distribution in numbers or percentages,
- the mode, median, or mean to find the central tendency,
- the range, standard deviation and variance to indicate the variability.
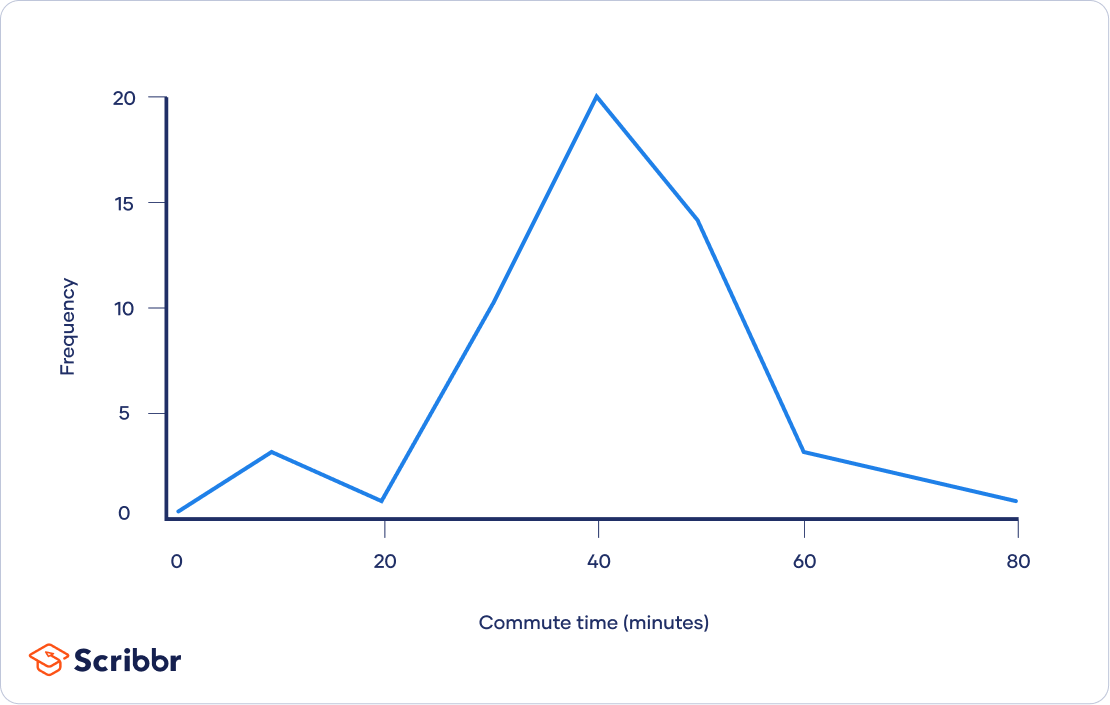
Distribution
You can get an overview of the frequency of different values in a table and visualize their distribution in a graph.
| Commute time (minutes) | Frequency |
| 1 – 10 | 3 |
|---|---|
| 11 – 20 | 1 |
| 21 – 30 | 9 |
| 31 – 40 | 19 |
| 41 – 50 | 13 |
| 51 – 60 | 3 |
| 61 – 70 | 2 |
| 71 – 80 | 1 |
Central tendency
From your graph, you can see that your data is fairly normally distributed. Since there is no skew, to find where most of your values lie, you can use all 3 common measures of central tendency: the mode, median and mean.
(n+1)/2 = (51+1)/2 = 26
The median is in the 26th position, which has a value of 36.4 minutes.
⅀x = 1883.5
n = 52
M = ⅀x/n = 1883.5/52 = 36.9
The mean is usually considered the best measure of central tendency when you have normally distributed quantitative data. That’s because it uses every single value in your data set for the computation, unlike the mode or the median.
Variability
The range, standard deviation and variance describe how spread your data is. The range is the easiest to compute; the standard deviation and variance are more complicated, but also more informative.
The coefficient of variation is a measure of spread that only applies to ratio variables.
Range = 72.5 – 7 = 65.5
s = 13.34
s2 = 178.04
CV = s/M
CV = 13.34/36.9 = 0.36
The coefficient of variation is 0.36 or 36%. This tells you that your data has a large spread because the coefficient of variation is 36% of the mean.
Statistical tests
Now that you have an overview of your data, you can select appropriate tests for statistical inferences. With a normal distribution of ratio data, parametric tests are best for testing hypotheses.
Parametric tests are more powerful than non-parametric tests and let you make stronger conclusions regarding your data. However, your data must meet several requirements for parametric tests to apply.
The following parametric tests are some of the most common ones applied to test hypotheses about ratio data.
| Aim | Samples or variables | Test | Example |
| Comparison of means | 2 samples | T-test | Is there a difference in the average commute time of employees in Boston and Los Angeles? |
| Comparison of means | 3 or more samples | ANOVA | Is there a difference in the average commute times of employees in North America, Asia and Europe? |
| Correlation | 2 variables | Pearson’s r | How are commute times and income levels related? |
| Regression | 2 variables | Simple linear regression | Does income predict average commute time? |
Other interesting articles
If you want to know more about statistics, methodology, or research bias, make sure to check out some of our other articles with explanations and examples.
Statistics
Methodology
Frequently asked questions about ratio data
Cite this Scribbr article
If you want to cite this source, you can copy and paste the citation or click the “Cite this Scribbr article” button to automatically add the citation to our free Citation Generator.
Bhandari, P. (2023, December 29). Ratio Scales | Definition, Examples, & Data Analysis. Scribbr. Retrieved July 1, 2026, from https://www.scribbr.com/statistics/ratio-data/
