Nominal Data | Definition, Examples, Data Collection & Analysis
Nominal data is labelled into mutually exclusive categories within a variable. These categories cannot be ordered in a meaningful way.
For example, preferred mode of transportation is a nominal variable, because the data is sorted into categories: car, bus, train, tram, bicycle, etc.
Levels of measurement
The level of measurement indicates how precisely data is recorded. There are 4 hierarchical levels: nominal, ordinal, interval, and ratio. The higher the level, the more complex the measurement.
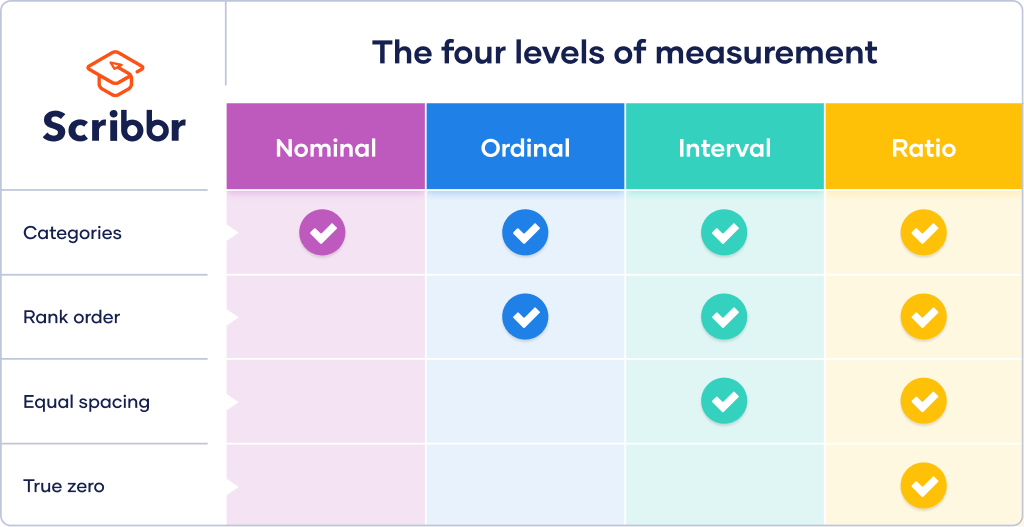
Nominal data is the least precise and complex level. The word nominal means “in name,” so this kind of data can only be labelled. It does not have a rank order, equal spacing between values, or a true zero value.

Examples of nominal data
At a nominal level, each response or observation fits only into one category.
Nominal data can be expressed in words or in numbers. But even if there are numerical labels for your data, you can’t order the labels in a meaningful way or perform arithmetic operations with them.
In social scientific research, nominal variables often include gender, ethnicity, political preferences or student identity number.
| Variable | Categories |
|---|---|
| Zip code |
|
| Political preferences |
|
| Employment status |
|
| Literary genre |
|
Variable types that can be coded in only 2 ways (e.g. yes/no or employed/unemployed) are called binary or dichotomous. Since the order of the labels within those variables doesn’t matter, they are types of nominal variable.
How to collect nominal data
Nominal data can be collected through open- or closed-ended survey questions.
If the variable you are interested in has only a few possible labels that capture all of the data, use closed-ended questions.
| What is your gender? | Male Female Other Prefer not to answer |
|---|---|
| Do you own a smartphone? | Yes No |
| What is your favorite movie genre? | Romance Action Mystery Animation Musical Comedy Thriller |
If your variable of interest has many possible labels, or labels that you cannot generate a complete list for, use open-ended questions.
- What is your student ID number?
- What is your zip code?
- What is your native language?
How to analyze nominal data
To analyze nominal data, you can organize and visualize your data in tables and charts.
Then, you can gather some descriptive statistics about your data set. These help you assess the frequency distribution and find the central tendency of your data. But not all measures of central tendency or variability are applicable to nominal data.
| Republican Democrat Independent Independent Republican Republican Republican Democrat Independent |
Independent Republican Democrat Democrat Democrat Democrat Republican Democrat Democrat |
Democrat Republican Democrat Democrat Independent Republican Republican Democrat Democrat |
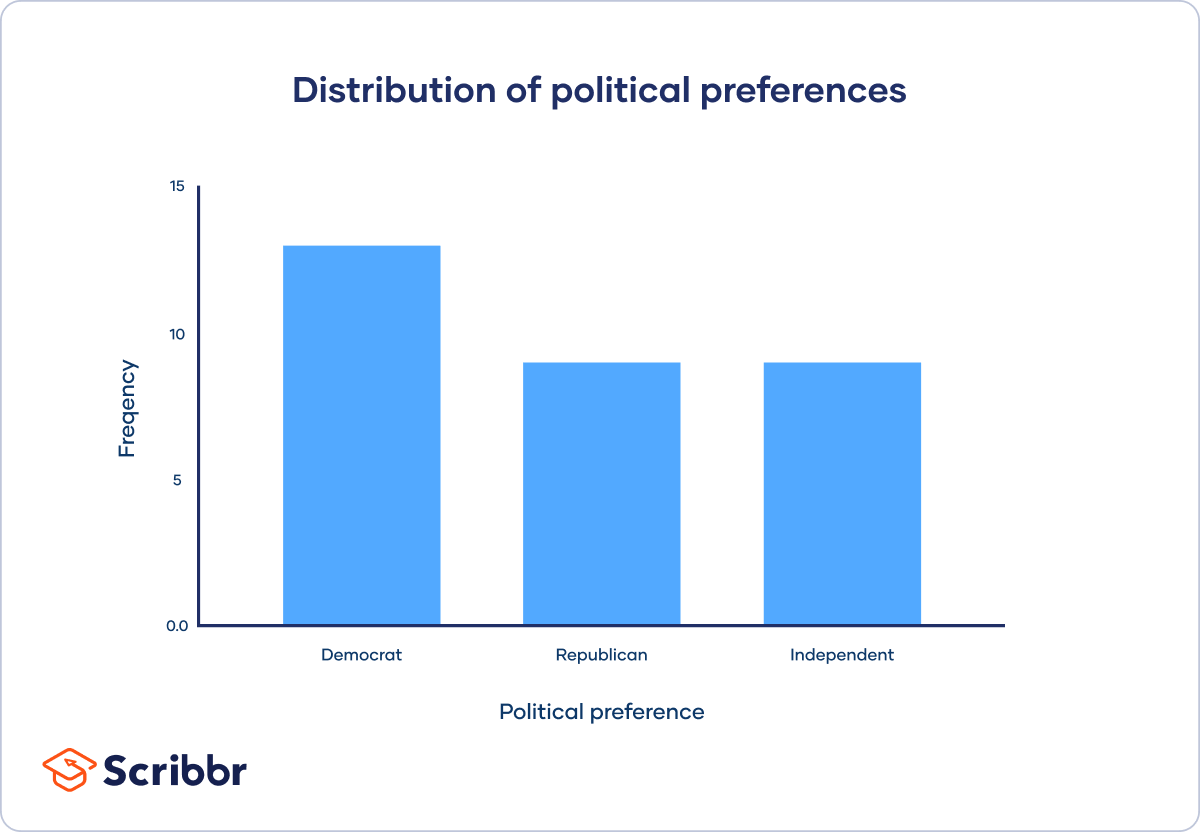
Distribution
To organize this data set, you can create a frequency distribution table to show you the number of responses for each category of political preference.
| Political preference | Frequency |
|---|---|
| Democrat | 13 |
| Republican | 9 |
| Independent | 5 |
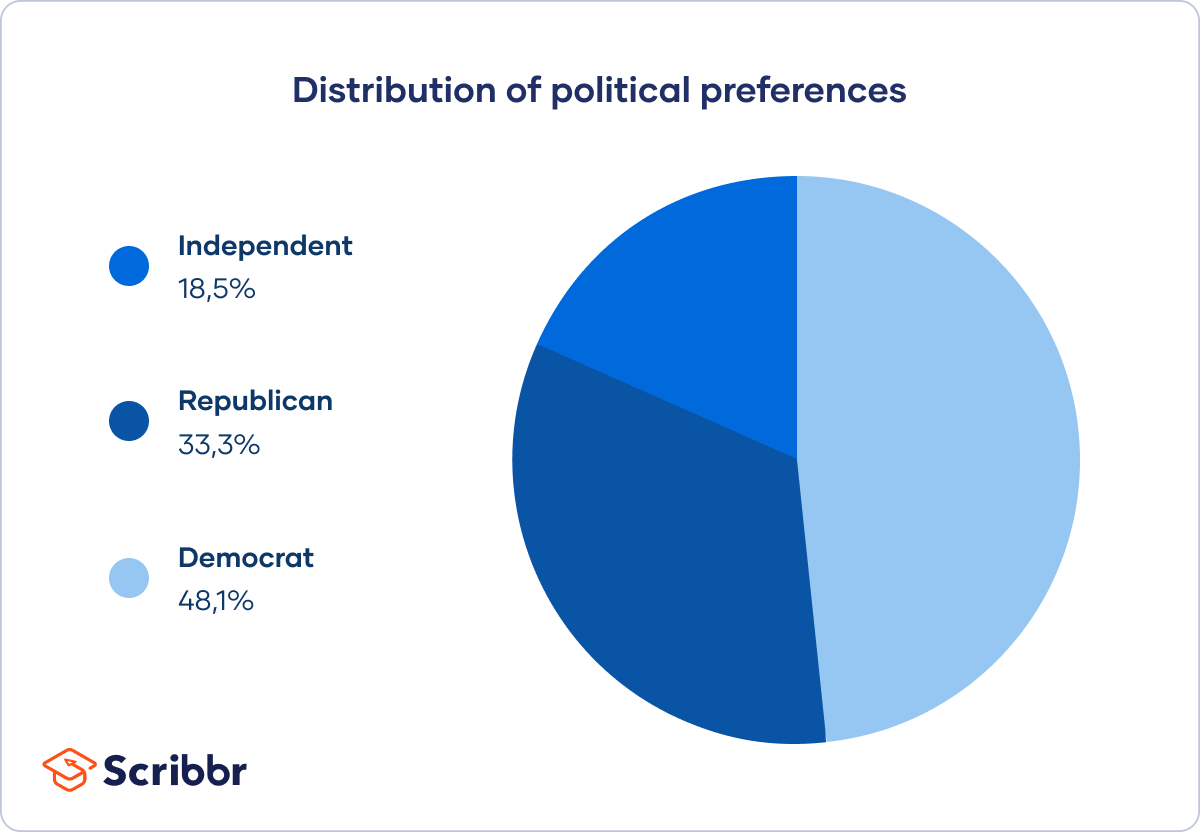
| Political preference | Percent |
|---|---|
| Democrat | 48.1% |
| Republican | 33.3% |
| Independent | 18.5% |
Using these tables, you can also visualize the distribution of your data set in graphs and charts.
Central tendency
The central tendency of your data set tells you where most of your values lie.
The mode, mean, and median are three most commonly used measures of central tendency. However, only the mode can be used with nominal data.
To get the median of a data set, you have to be able to order values from low to high. For the mean, you need to be able to perform arithmetic operations like addition and division on the values in the data set. While nominal data can be grouped by category, it cannot be ordered nor summed up.
Therefore, the central tendency of nominal data can only be expressed by the mode – the most frequently recurring value.
Since most participants in your study identify as Democrat, the mode is Democrat.
Statistical tests for nominal data
Inferential statistics help you test scientific hypotheses about your data. Nonparametric statistical tests are used with nominal data.
While parametric tests assume certain characteristics about a data set, like a normal distribution of scores, these do not apply to nominal data because the data cannot be ordered in any meaningful way.
Chi-square tests are nonparametric statistical tests for categorical variables. The goodness of fit chi-square test can be used on a data set with one variable, while the chi-square test of independence is used on a data set with two variables.
The chi-square goodness of fit test is used when you have gathered data from a single population through random sampling. To measure how representative your sample is, you can use this test to assess whether the frequency distribution of your sample matches what you would expect from the broader population.
The goodness of fit test statistic tells you how different what you observe is from what you would expect by chance. If the test statistic is zero, there is no difference between what you expect and what you observe.
With the chi-square test of independence, you can find out whether a relationship between two categorical variables is statistically significant.
Other interesting articles
If you want to know more about statistics, methodology, or research bias, make sure to check out some of our other articles with explanations and examples.
Statistics
Methodology
Cite this Scribbr article
If you want to cite this source, you can copy and paste the citation or click the “Cite this Scribbr article” button to automatically add the citation to our free Citation Generator.
Bhandari, P. (2023, June 21). Nominal Data | Definition, Examples, Data Collection & Analysis. Scribbr. Retrieved July 1, 2026, from https://www.scribbr.com/statistics/nominal-data/
