Explanatory and Response Variables | Definitions & Examples
In research, you often investigate causal relationships between variables using experiments or observations. For example, you might test whether caffeine improves speed by providing participants with different doses of caffeine and then comparing their reaction times.
An explanatory variable is what you manipulate or observe changes in (e.g., caffeine dose), while a response variable is what changes as a result (e.g., reaction times).
The words “explanatory variable” and “response variable” are often interchangeable with other terms used in research.
| Cause (what changes) | Effect (what’s measured) |
|---|---|
| Independent variable | Dependent variable |
| Predictor variable | Outcome/criterion variable |
| Explanatory variable | Response variable |
Explanatory vs. response variables
The difference between explanatory and response variables is simple:
- An explanatory variable is the expected cause, and it explains the results.
- A response variable is the expected effect, and it responds to explanatory variables.
You expect changes in the response variable to happen only after changes in an explanatory variable.
There’s a causal relationship between the variables that may be indirect or direct. In an indirect relationship, an explanatory variable may act on a response variable through a mediator.
If you’re dealing with a purely correlational relationship, there are no explanatory and response variables. Even if changes in one variable are associated with changes in another, both might be caused by a confounding variable.
Errors relating to your variables can lead to research biases like omitted variable bias and information bias.
Examples of explanatory and response variables
In some studies, you’ll have only one explanatory variable and one response variable, but in more complicated research, you may predict one or more response variable(s) using several explanatory variables in a model.
| Research question | Explanatory variables | Response variable |
|---|---|---|
| Does academic motivation predict performance? |
|
|
| Can overconfidence and risk perception explain financial risk taking behaviors? |
|
|
| Does the weather affect the transmission of Covid-19? |
|
|

Explanatory vs independent variables
Explanatory variables and independent variables are very similar, but there are subtle differences between them.
In research contexts, independent variables supposedly aren’t affected by or dependent on any other variable—they’re manipulated or altered only by researchers. For example, if you run a controlled experiment where you can control exactly how much caffeine each participant receives, then caffeine dose is an independent variable.
But sometimes, the term “explanatory variable” is preferred over “independent variable”, because in real world contexts, independent variables are often influenced by other variables. That means they’re not truly independent.
You gather a sample of young adults and ask them to complete a survey in the lab. They report their risk perceptions of different threatening scenarios while you record their stress reactions physiologically.
In your analyses, you find that gender identity and risk perception are highly correlated with each other. Participants who identify as women are more likely to rate situations as riskier than those who identify as men.
This means gender identity and risk perception are not independent of each other. It’s more accurate to call them explanatory variables for the response variable of stress reaction.
You’ll often see the terms “explanatory variable” and “response variable” used in regression analyses, which focus on predicting or accounting for changes in response variables as a result of explanatory variables.
Visualizing explanatory and response variables
The easiest way to visualize the relationship between an explanatory variable and a response variable is with a graph.
On graphs, the explanatory variable is conventionally placed on the x-axis, while the response variable is placed on the y-axis.
- If you have quantitative variables, use a scatterplot or a line graph.
- If your response variable is categorical, use a scatterplot or a line graph.
- If your explanatory variable is categorical, use a bar graph.
When you have only one explanatory variable and one response variable, you’ll collect paired data. This means every response variable measurement is linked to an explanatory variable value for each unit or participant.
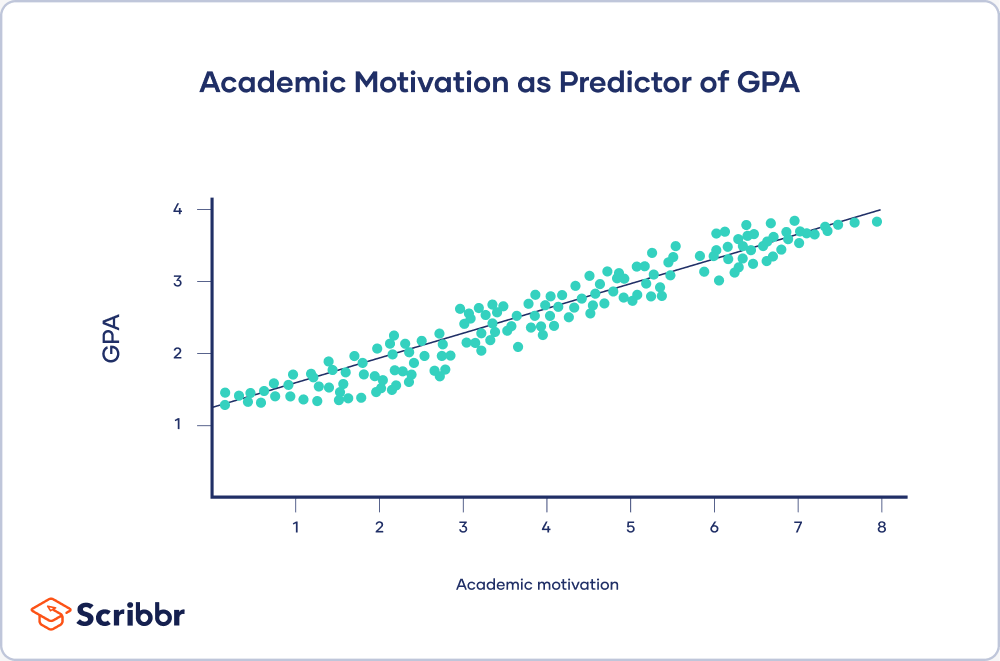
- Your explanatory variable is academic motivation at the start of the school year.
- Your response variable is GPA at the end of the school year.
Academic motivation is assessed using an 8-point scale, while GPA can range from 0–4. To visualize your data, you plot academic motivation at the start of the year on the x-axis and GPA at the end of the year on the y-axis. Each data point reflects the paired data of one participant.
From the scatterplot, you can see a clear explanatory relationship between academic motivation at the start of the year and GPA at the end of the year.
Other interesting articles
If you want to know more about statistics, methodology, or research bias, make sure to check out some of our other articles with explanations and examples.
Methodology
Here's why students love Scribbr's proofreading services
Frequently asked questions about explanatory and response variables
Cite this Scribbr article
If you want to cite this source, you can copy and paste the citation or click the “Cite this Scribbr article” button to automatically add the citation to our free Citation Generator.
Bhandari, P. (2023, June 22). Explanatory and Response Variables | Definitions & Examples. Scribbr. Retrieved July 9, 2026, from https://www.scribbr.com/methodology/explanatory-and-response-variables/
