Published on
March 8, 2021
by
Pritha Bhandari.
Revised on
January 24, 2025.
In experimental research, random assignment is a way of placing participants from your sample into different treatment groups using randomization.
With simple random assignment, every member of the sample has a known or equal chance of being placed in a control group or an experimental group. Studies that use simple random assignment are also called completely randomized designs.
Random assignment is a key part of experimental design. It helps you ensure that all groups are comparable at the start of a study: any differences between them are due to random factors, not research biases like sampling bias or selection bias.
Published on
March 1, 2021
by
Pritha Bhandari.
Revised on
June 22, 2023.
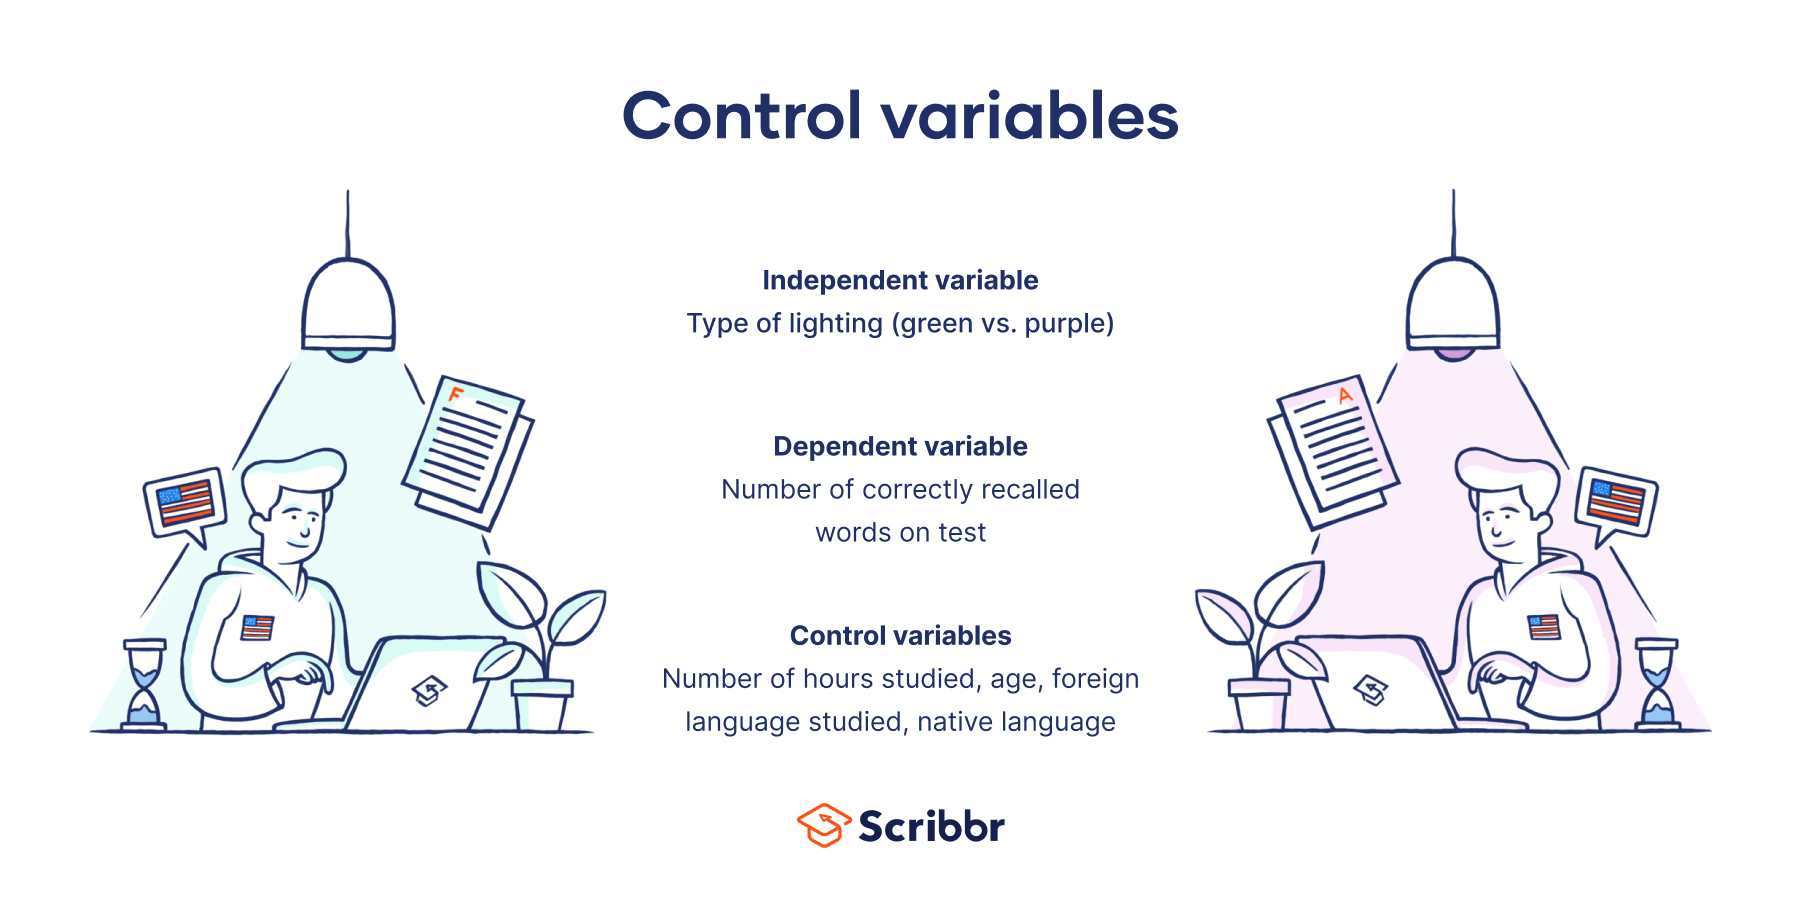
A control variable is anything that is held constant or limited in a research study. It’s a variable that is not of interest to the study’s objectives, but is controlled because it could influence the outcomes.
Variables may be controlled directly by holding them constant throughout a study (e.g., by controlling the room temperature in an experiment), or they may be controlled indirectly through methods like randomization or statistical control (e.g., to account for participant characteristics like age in statistical tests). Control variables can help prevent research biases like omitted variable bias from affecting your results.
Examples of control variables
Research question
Control variables
Does soil quality affect plant growth?
Temperature
Amount of light
Amount of water
Does caffeine improve memory recall?
Participant age
Noise in the environment
Type of memory test
Do people with a fear of spiders perceive spider images faster than other people?
Published on
March 1, 2021
by
Pritha Bhandari.
Revised on
June 22, 2023.
A mediating variable (or mediator) explains the process through which two variables are related, while a moderating variable (or moderator) affects the strength and direction of that relationship.
Including mediators and moderators in your research helps you go beyond studying a simple relationship between two variables for a fuller picture of the real world. These variables are important to consider when studying complex correlational or causal relationships between variables.
Published on
February 16, 2021
by
Pritha Bhandari.
Revised on
February 21, 2025.
Statistical power, or sensitivity, is the likelihood of a significance test detecting an effect when there actually is one.
A true effect is a real, non-zero relationship between variables in a population. An effect is usually indicated by a real difference between groups or a correlation between variables.
High power in a study indicates a large chance of a test detecting a true effect. Low power means that your test only has a small chance of detecting a true effect or that the results are likely to be distorted by random and systematic error.
Power is mainly influenced by sample size, effect size, and significance level. A power analysis can be used to determine the necessary sample size for a study.
Published on
February 5, 2021
by
Pritha Bhandari.
Revised on
June 22, 2023.
The methods section of an APA style paper is where you report in detail how you performed your study. Research papers in the social and natural sciences often follow APA style. This article focuses on reporting quantitative research methods.
In your APA methods section, you should report enough information to understand and replicate your study, including detailed information on the sample, measures, and procedures used.
Published on
January 18, 2021
by
Pritha Bhandari.
Revised on
June 22, 2023.
In statistics, a Type I error is a false positive conclusion, while a Type II error is a false negative conclusion.
Making a statistical decision always involves uncertainties, so the risks of making these errors are unavoidable in hypothesis testing.
The probability of making a Type I error is the significance level, or alpha (α), while the probability of making a Type II error is beta (β). These risks can be minimized through careful planning in your study design.
Example: Type I vs Type II errorYou decide to get tested for COVID-19 based on mild symptoms. There are two errors that could potentially occur:
Type I error (false positive): the test result says you have coronavirus, but you actually don’t.
Type II error (false negative): the test result says you don’t have coronavirus, but you actually do.
Published on
January 7, 2021
by
Pritha Bhandari.
Revised on
June 22, 2023.
If a result is statistically significant, that means it’s unlikely to be explained solely by chance or random factors. In other words, a statistically significant result has a very low chance of occurring if there were no true effect in a research study.
The p value, or probability value, tells you the statistical significance of a finding. In most studies, a p value of 0.05 or less is considered statistically significant, but this threshold can also be set higher or lower.
Published on
December 22, 2020
by
Pritha Bhandari.
Revised on
June 22, 2023.
Effect size tells you how meaningful the relationship between variables or the difference between groups is. It indicates the practical significance of a research outcome.
A large effect size means that a research finding has practical significance, while a small effect size indicates limited practical applications.
NoteThere are several ways to report your results. In this article, we follow APA guidelines.
Published on
December 21, 2020
by
Pritha Bhandari.
Revised on
January 14, 2025.
The results section of a quantitative research paper is where you summarize your data and report the findings of any relevant statistical analyses.
The APA manual provides rigorous guidelines for what to report in quantitative research papers in the fields of psychology, education, and other social sciences.
Use these standards to answer your research questions and report your data analyses in a complete and transparent way.
TipYou can use Scribbr’s free APA Citation Generator to create accurate citations automatically.
Published on
December 11, 2020
by
Pritha Bhandari.
Revised on
June 22, 2023.
The standard error of the mean, or simply standard error, indicates how different the population mean is likely to be from a sample mean. It tells you how much the sample mean would vary if you were to repeat a study using new samples from within a single population.
The standard error of the mean (SE or SEM) is the most commonly reported type of standard error. But you can also find the standard error for other statistics, like medians or proportions. The standard error is a common measure of sampling error—the difference between a population parameter and a sample statistic.