Published on
November 27, 2020
by
Pritha Bhandari.
Revised on
June 22, 2023.
A parameter is a number describing a whole population (e.g., population mean), while a statistic is a number describing a sample (e.g., sample mean).
The goal of quantitative research is to understand characteristics of populations by finding parameters. In practice, it’s often too difficult, time-consuming or unfeasible to collect data from every member of a population. Instead, data is collected from samples.
With inferential statistics, we can use sample statistics to make educated guesses about population parameters.
Any normal distribution can be standardized by converting its values into z scores. Z scores tell you how many standard deviations from the mean each value lies.
Converting a normal distribution into a z-distribution allows you to calculate the probability of certain values occurring and to compare different data sets.
Published on
October 23, 2020
by
Pritha Bhandari.
Revised on
June 21, 2023.
In a normal distribution, data is symmetrically distributed with no skew. When plotted on a graph, the data follows a bell shape, with most values clustering around a central region and tapering off as they go further away from the center.
Normal distributions are also called Gaussian distributions or bell curves because of their shape.
Published on
October 9, 2020
by
Pritha Bhandari.
Revised on
June 21, 2023.
The mean (aka the arithmetic mean, different from the geometric mean) of a dataset is the sum of all values divided by the total number of values. It’s the most commonly used measure of central tendency and is often referred to as the “average.”
Published on
October 2, 2020
by
Pritha Bhandari.
Revised on
June 21, 2023.
The median is the value that’s exactly in the middle of a dataset when it is ordered. It’s a measure of central tendency that separates the lowest 50% from the highest 50% of values.
The steps for finding the median differ depending on whether you have an odd or an even number of data points. If there are two numbers in the middle of a dataset, their mean is the median.
The median is usually used with quantitative data (where the values are numerical), but you can sometimes also find the median for an ordinal dataset (where the values are ranked categories).
Published on
October 2, 2020
by
Pritha Bhandari.
Revised on
June 21, 2023.
The mode or modal value of a data set is the most frequently occurring value. It’s a measure of central tendency that tells you the most popular choice or most common characteristic of your sample.
When reporting descriptive statistics, measures of central tendency help you find the middle or the average of your data set. The three most common measures of central tendency are the mode, median, and mean.
Published on
September 25, 2020
by
Pritha Bhandari.
Revised on
June 21, 2023.
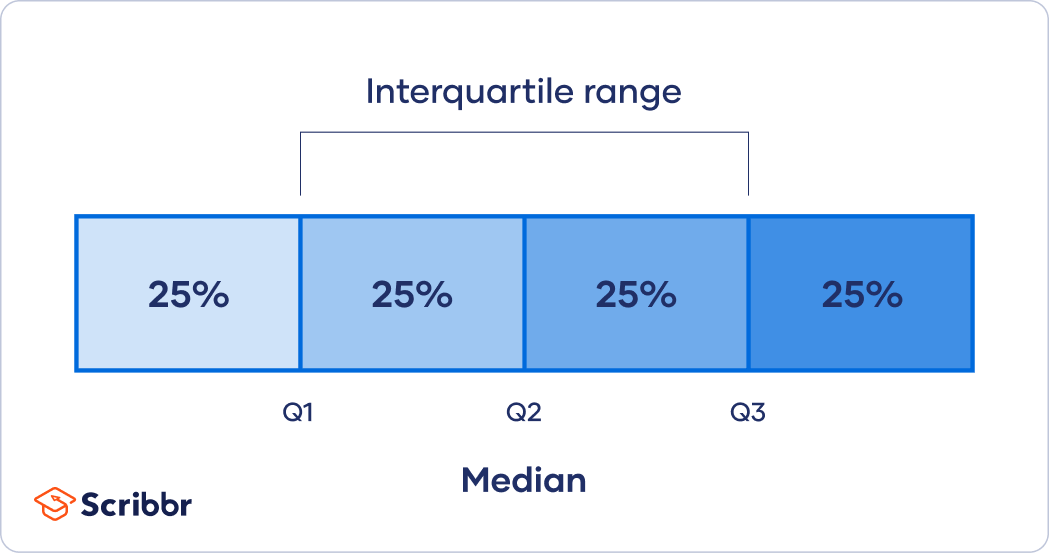
In descriptive statistics, the interquartile range tells you the spread of the middle half of your distribution.
Quartiles segment any distribution that’s ordered from low to high into four equal parts. The interquartile range (IQR) contains the second and third quartiles, or the middle half of your data set.
Whereas the range gives you the spread of the whole data set, the interquartile range gives you the range of the middle half of a data set.
Published on
September 17, 2020
by
Pritha Bhandari.
Revised on
March 28, 2024.
The standard deviation is the average amount of variability in your dataset. It tells you, on average, how far each value lies from the mean.
A high standard deviation means that values are generally far from the mean, while a low standard deviation indicates that values are clustered close to the mean.
Published on
September 11, 2020
by
Pritha Bhandari.
Revised on
June 21, 2023.
In statistics, the range is the spread of your data from the lowest to the highest value in the distribution. It is a commonly used measure of variability.
The range is calculated by subtracting the lowest value from the highest value. While a large range means high variability, a small range means low variability in a distribution.
Published on
September 7, 2020
by
Pritha Bhandari.
Revised on
June 21, 2023.
Variability describes how far apart data points lie from each other and from the center of a distribution. Along with measures of central tendency, measures of variability give you descriptive statistics that summarize your data.
Variability is also referred to as spread, scatter or dispersion. It is most commonly measured with the following:
Range: the difference between the highest and lowest values