Published on
September 4, 2020
by
Pritha Bhandari.
Revised on
June 22, 2023.
While descriptive statistics summarize the characteristics of a data set, inferential statistics help you come to conclusions and make predictions based on your data.
When you have collected data from a sample, you can use inferential statistics to understand the larger population from which the sample is taken.
Inferential statistics have two main uses:
making estimates about populations (for example, the mean SAT score of all 11th graders in the US).
testing hypotheses to draw conclusions about populations (for example, the relationship between SAT scores and family income).
Published on
August 28, 2020
by
Pritha Bhandari.
Revised on
December 29, 2023.
A ratio scale is a quantitative scale where there is a true zero and equal intervals between neighboring points. Unlike on an interval scale, a zero on a ratio scale means there is a total absence of the variable you are measuring.
Length, area, and population are examples of ratio scales.
Published on
August 28, 2020
by
Pritha Bhandari.
Revised on
June 21, 2023.
Interval data is measured along a numerical scale that has equal distances between adjacent values. These distances are called “intervals.”
There is no true zero on an interval scale, which is what distinguishes it from a ratio scale. On an interval scale, zero is an arbitrary point, not a complete absence of the variable.
Common examples of interval scales include standardized tests, such as the SAT, and psychological inventories.
Published on
August 12, 2020
by
Pritha Bhandari.
Revised on
June 21, 2023.
Ordinal data is classified into categories within a variable that have a natural rank order. However, the distances between the categories are uneven or unknown.
For example, the variable “frequency of physical exercise” can be categorized into the following:
1. Never
2. Rarely
3. Sometimes
4. Often
5. Always
There is a clear order to these categories, but we cannot say that the difference between “never” and “rarely” is exactly the same as that between “sometimes” and “often”. Therefore, this scale is ordinal.
Published on
July 30, 2020
by
Pritha Bhandari.
Revised on
June 21, 2023.
Measures of central tendency help you find the middle, or the average, of a dataset. The 3 most common measures of central tendency are the mode, median, and mean.
Published on
July 9, 2020
by
Pritha Bhandari.
Revised on
June 21, 2023.
Descriptive statistics summarize and organize characteristics of a data set. A data set is a collection of responses or observations from a sample or entire population.
In quantitative research, after collecting data, the first step of statistical analysis is to describe characteristics of the responses, such as the average of one variable (e.g., age), or the relation between two variables (e.g., age and creativity).
The next step is inferential statistics, which help you decide whether your data confirms or refutes your hypothesis and whether it is generalizable to a larger population.
Published on
July 3, 2020
by
Pritha Bhandari
Revised on
June 22, 2023.
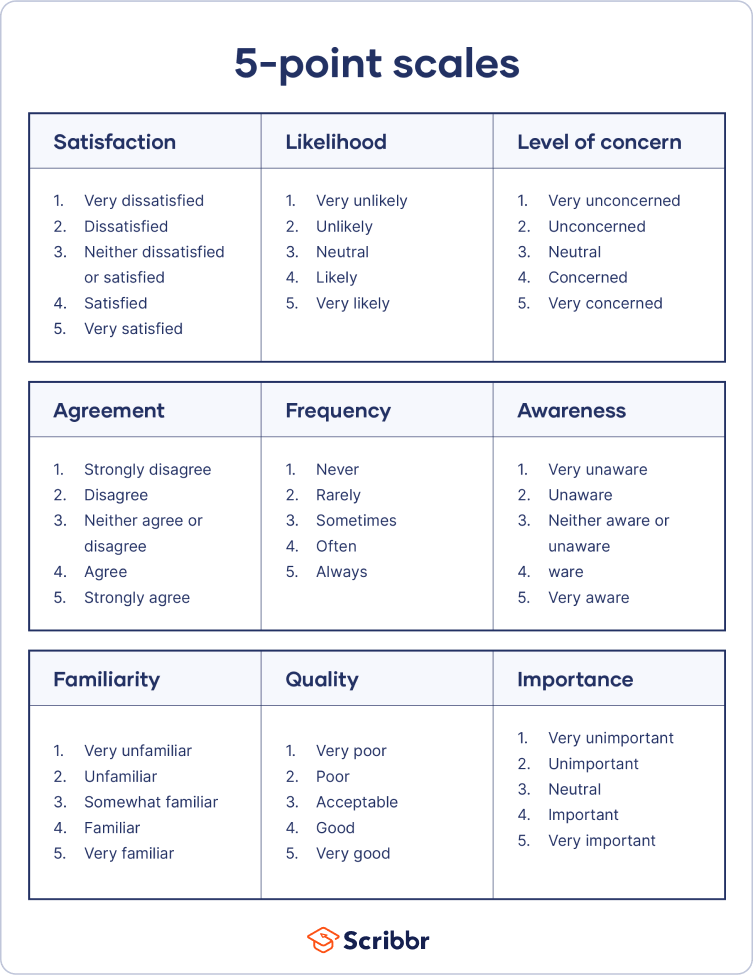
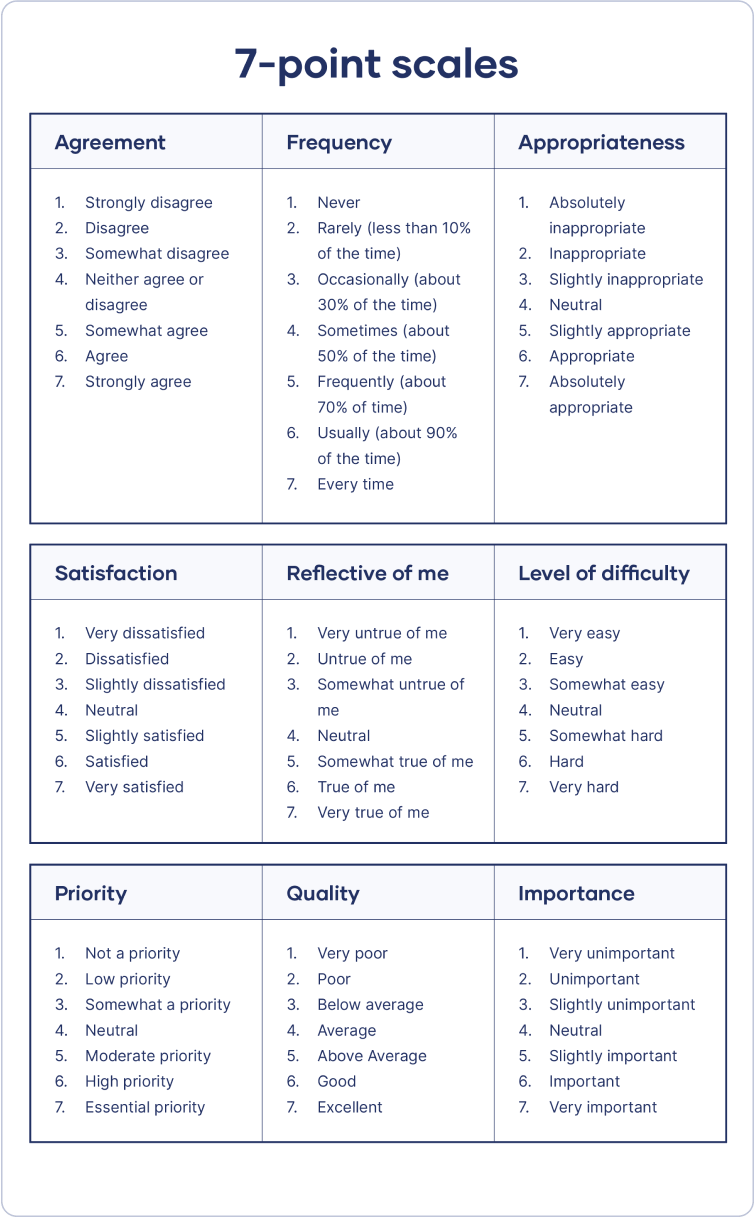
A Likert scale is a rating scale used to measure opinions, attitudes, or behaviors.
It consists of a statement or a question, followed by a series of five or seven answer statements. Respondents choose the option that best corresponds with how they feel about the statement or question.
Because respondents are presented with a range of possible answers, Likert scales are great for capturing the level of agreement or their feelings regarding the topic in a more nuanced way. However, Likert scales are prone to response bias, where respondents either agree or disagree with all the statements due to fatigue or social desirability or have a tendency toward extreme responding or other demand characteristics.
Likert scales are common in survey research, as well as in fields like marketing, psychology, or other social sciences.
Published on
June 19, 2020
by
Pritha Bhandari.
Revised on
January 14, 2025.
Qualitative research involves collecting and analyzing non-numerical data (e.g., text, video, or audio) to understand concepts, opinions, or experiences. It can be used to gather in-depth insights into a problem or generate new ideas for research.
Qualitative research is the opposite of quantitative research, which involves collecting and analyzing numerical data for statistical analysis.
Qualitative research is commonly used in the humanities and social sciences, in subjects such as anthropology, sociology, education, health sciences, history, etc.
Qualitative research question examples
How does social media shape body image in teenagers?
How do children and adults interpret healthy eating in the UK?
What factors influence employee retention in a large organization?
How is anxiety experienced around the world?
How can teachers integrate social issues into science curriculums?
NoteAI tools can be helpful resources when formultating your research questions and designing certain data collection methods (e.g., surveys). However, it’s important to use these tools responsibly to avoid academic dishonesty. Your university or institution may use a plagiarism checker or AI detector to detect generative AI content.
Published on
June 12, 2020
by
Pritha Bhandari.
Revised on
June 22, 2023.
Quantitative research is the process of collecting and analyzing numerical data. It can be used to find patterns and averages, make predictions, test causal relationships, and generalize results to wider populations.
Quantitative research is the opposite of qualitative research, which involves collecting and analyzing non-numerical data (e.g., text, video, or audio).
Quantitative research is widely used in the natural and social sciences: biology, chemistry, psychology, economics, sociology, marketing, etc.
Quantitative research question examples
What is the demographic makeup of Singapore in 2020?
How has the average temperature changed globally over the last century?
Does environmental pollution affect the prevalence of honey bees?
Does working from home increase productivity for people with long commutes?