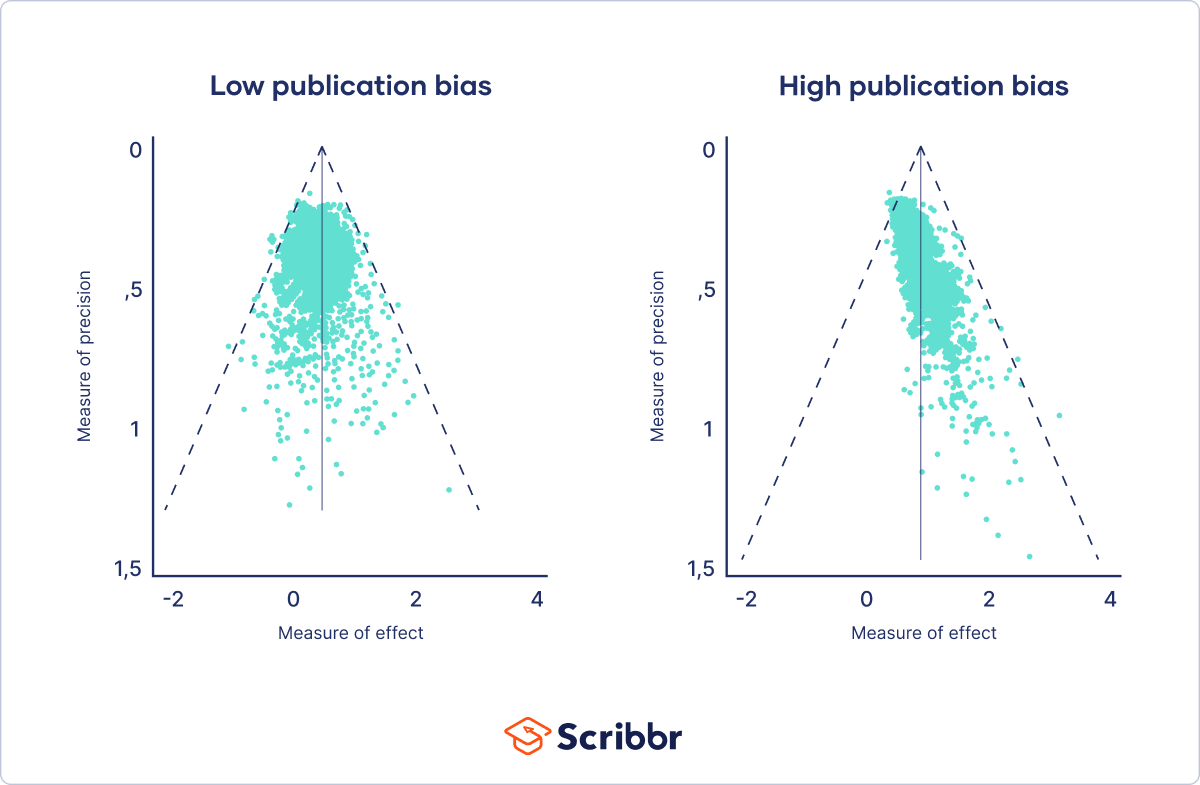
How does a funnel plot measure publication bias?
A funnel plot shows the relation between a study’s effect size and its precision. It is a scatter plot of the treatment effects estimated from individual studies (horizontal axis) against sample size (vertical axis).
Asymmetry in the funnel plot, measured using regression analysis, is an indication of publication bias. In the absence of bias, results from small studies will scatter widely at the bottom of the graph, with the spread narrowing among larger studies.
The idea here is that small studies are more likely to remain unpublished if their results are nonsignificant or unfavorable, whereas larger studies get published regardless. This leads to asymmetry in the funnel plot.
Related Posts
Frequently asked questions: Research bias
- Why is perception bias a problem?
-
Perception bias is a problem because it prevents us from seeing situations or people objectively. Rather, our expectations, beliefs, or emotions interfere with how we interpret reality. This, in turn, can cause us to misjudge ourselves or others. For example, our prejudices can interfere with whether we perceive people’s faces as friendly or unfriendly.
- What is the bandwagon effect?
-
The bandwagon effect is a type of cognitive bias. It describes the tendency of people to adopt behaviors or opinions simply because others are doing so, regardless of their own beliefs.
- What is the difference between belief bias and confirmation bias?
-
Belief bias and confirmation bias are both types of cognitive bias that impact our judgment and decision-making.
Confirmation bias relates to how we perceive and judge evidence. We tend to seek out and prefer information that supports our preexisting beliefs, ignoring any information that contradicts those beliefs.
Belief bias describes the tendency to judge an argument based on how plausible the conclusion seems to us, rather than how much evidence is provided to support it during the course of the argument.
- What is an availability heuristic example in everyday life?
-
The availability heuristic can influence our perception of risk in everyday life. One common example occurs when we are considering buying insurance. The sharp increase in purchases of flood insurance in the aftermath of flood events illustrates this phenomenon.
Witnessing such events, knowing someone who was personally affected, or extensive media coverage can make us more aware of floods (or make floods more “available” to us). This can change our risk perception, even though statistically there may not be a change in the probabilities of future flooding.
- What is an example of heuristic in psychology?
-
Heuristics are mental shortcuts or rules of thumb that help people reduce the time and effort required to make a decision. An example of a heuristic in psychology is the availability heuristic (or availability bias). It involves relying on information that comes to mind quickly, (i.e., information that is available to us).
- What is the difference between availability bias vs confirmation bias?
-
Although both are common types of cognitive bias, they refer to different ways of processing information.
- The availability bias (or availability heuristic) refers to the tendency people have to rely on information that is easier to recall when faced with a decision.
- Confirmation bias is the tendency to selectively search for or interpret information in a way that confirms one’s preconceived ideas.
In other words, the availability heuristic gives preference to information that is easy to recall, while confirmation bias gives preference to information that aligns with our existing beliefs. Even though they are different, they both cause us to focus on only a subset of information.
- What is the framing effect in polling?
-
In survey research, such as political polling, the way questions are worded or the order in which answers are presented can influence how respondents answer the questions. This is called the framing effect.
For example, if voters are asked to select which of two candidates they plan to vote for, the order in which the candidates are listed affects the percentage of respondents selecting each candidate. Recognizing the potential for research bias, researchers typically rotate which major candidate is listed first and which is listed second.
- What is the framing effect in advertising?
-
The framing effect is often used in advertising to positively influence consumer choice.
One common type of frame is “gain framing.” This shows consumers how they are going to benefit from a product or service. For example, dental care product advertisements use gain framing to display the benefits of using their product: white teeth, healthy gums, fresh breath, etc.
Apart from the obvious benefits, ads using the framing effect often imply other benefits, such as how a better-looking smile makes one more attractive to potential dating partners.
- What is the framing effect in economics?
-
Because of the framing effect, the way information is presented to us influences how attractive a proposition is.
Suppose you are considering joining a gym. A membership at $500 per year sounds like a considerable investment and might prevent you from signing up immediately. However, if they tell you it costs just $1.37 per day and emphasize that this is less than the cost of a cup of coffee, you might think it’s a great offer, even though in reality both offers cost you the same.
- What is the opposite of implicit bias?
-
The opposite of implicit bias is explicit bias, or conscious bias. This refers to preferences, opinions, and attitudes of which people are generally consciously aware. In other words, explicit bias is expressed openly and deliberately.
- What is the opposite of optimism bias?
-
The opposite of optimism bias is pessimism bias. Optimism bias occurs when we overestimate our chances of experiencing positive events in our lives, while pessimism bias occurs when we overestimate our chance of experiencing negative events.
For example, pessimism bias could cause someone to think they are going to fail an exam, even though they are well prepared and usually get good grades.
- What is a positive illusion?
-
A positive illusion is a form of self-deception under which people have inflated, favorable attitudes about themselves or others close to them.
The most common positive illusions involve:
- Exaggerating one’s positive traits
- Overestimating one’s degree of control in life
- Harboring overly optimistic beliefs about future events (also called optimism bias).
- What is the planning fallacy?
-
The planning fallacy refers to people’s tendency to underestimate the resources needed to complete a future task, despite knowing that previous tasks have also taken longer than planned.
For example, people generally tend to underestimate the cost and time needed for construction projects. The planning fallacy occurs due to people’s tendency to overestimate the chances that positive events, such as a shortened timeline, will happen to them. This phenomenon is called optimism bias.
- What is myside bias?
-
Myside bias is a type of cognitive bias where individuals process information in a way that favors their prior beliefs and attitudes. It occurs when people search for, interpret, and recall information that confirms their opinions, and refute opinions different from their own—such as selecting news sources that agree with one’s political affiliation, while ignoring any opposing arguments from other sources.
Myside bias is closely related to confirmation bias. Although some researchers use the terms interchangeably, others use myside bias to refer to the tendency of processing information that supports one’s own position.
- What are common types of cognitive bias?
-
Cognitive bias is an umbrella term used to describe the different ways in which our beliefs and experiences impact our judgment and decision making. These preconceptions are “mental shortcuts” that help us speed up how we process and make sense of new information.
However, this tendency may lead us to misunderstand events, facts, or other people. Cognitive bias can be a source of research bias.
Some common types of cognitive bias are:
- Anchoring bias
- Framing effect
- Actor–observer bias
- Availability heuristic
- Belief bias
- Confirmation bias
- The halo effect
- The Baader–Meinhof phenomenon
- What is an everyday life example of perception bias?
-
A real-life example of perception bias is the false consensus effect. Because we spend most of our time with friends, family, and colleagues who share the same opinions or values we do, we are often misled to believe that the majority of people think or act in ways similar to us. This explains, for instance, why some people take office supplies home: they may genuinely feel that this behavior is more common than it really is.
- What is selective perception?
-
Selective perception is the unconscious process by which people screen, select, and notice objects in their environment. During this process, information tends to be selectively perceived in ways that align with existing attitudes, beliefs, and goals.
Although this allows us to concentrate only on the information that is relevant for us at present, it can also lead to perception bias. For example, while driving, if you become hyper-focused on reaching your exit on a highway, your brain may filter visual stimuli so that you can only focus on things you need to notice in order to exit the highway. However, this can also cause you to miss other things happening around you on the road.
- What is the difference between correspondence bias and fundamental attribution error?
-
Correspondence bias and fundamental attribution error were often seen as interchangeable in the past. However, researchers have recently proposed that there is a subtle difference between the two.
- Correspondence bias refers to the fact that behavior is often viewed as a reflection of a person’s character. In other words, we believe that a person’s behavior reflects stable internal qualities, even though it was actually caused by the situation.
The fundamental attribution error refers to the idea that people fundamentally ignore or underestimate situational influences on others’ behavior. - Although people often commit the fundamental attribution error, they do not necessarily fall for correspondence bias at the same time. Only when we take the fundamental attribution error one step further and judge a person’s character from their actions do we display correspondence bias.
- Correspondence bias refers to the fact that behavior is often viewed as a reflection of a person’s character. In other words, we believe that a person’s behavior reflects stable internal qualities, even though it was actually caused by the situation.
- Why is correspondence bias a problem?
-
Correspondence bias is a problem because it can cause us to make incorrect judgments about other people’s behaviors. This can lead to misunderstandings that can negatively affect our relationship with them. When we overlook the situation and jump to conclusions about an individual’s character, it is also easier to justify reacting to them aggressively.
In a wider social context, if we ignore the situational factors that might have pushed someone to behave a certain way, we may also ignore systemic factors, like discrimination. For example, some people attribute poverty and unemployment to individuals rather than to social conditions.
- What is a real-life example of correspondence bias?
-
A real-life example of correspondence bias is how we think about people who cut in line. For example, you are waiting in line at the airport and someone cuts in front of you at the security checkpoint. Because of correspondence bias, your immediate reaction is to feel annoyed and think that the person must be entitled and rude. In reality, this person may never cut into lines and they are doing this only because they are about to miss their plane, which they are taking to visit a sick family member.
- What is the opposite of normalcy bias?
-
The opposite of normalcy bias is overreaction or worst-case scenario bias. This happens when people exaggerate the likelihood of negative outcomes or consequences when faced with a threat warning. In other words, people jump to the worst possible conclusion, no matter how improbable it is. For instance panic-buying of toilet paper, face masks, and food in the early days of the COVID-19 outbreak are examples of overreaction.
- What is the difference between normalcy bias and optimism bias?
-
Normalcy bias and optimism bias are closely related as they both influence our risk perception. However, they are two separate phenomena.
- Normalcy bias denotes our tendency to minimize or ignore threat warnings and to believe that nothing can seriously disrupt our everyday life.
- Optimism bias, on the other hand, denotes the tendency to overestimate the likelihood of positive events and underestimate the likelihood of negative events.
Although normalcy bias and optimism bias are distinct types of bias, they may reinforce each other. For instance, an individual who receives a hurricane alert may underestimate how serious it is (normalcy bias) and may also think that even if the hurricane affects their area, nothing bad will happen to them personally (optimism bias).
- What is normality bias?
-
Normality bias (or normalcy bias) is the tendency to underestimate the likelihood or impact of a potential hazard, based on the belief that things will continue as they have in the past. For example, you hear a sudden noise and think it must be fireworks. However, in reality it’s a gunshot. Instead of finding a safe spot, you go about your business because your brain “normalizes” the noise.
- Why is vividness bias important?
-
Vividness bias is important because it can affect our decisions and negotiations. It causes us to assign more weight to vivid information, like a perception of prestige, rather than other factors that, upon greater reflection, are more important to us. As a result, we get distracted and lose sight of our goals and priorities.
- What is a real-life example of vividness bias?
-
A real-life example of vividness bias can often be observed in the outcome of business negotiations. Price is usually the most vivid information, while other aspects, such the complexity of implementation, or the time needed to complete the project, might be ignored.
- What is the vividness effect in communication?
-
The vividness effect in communication is the persuasive impact that vivid information is thought to have on opinions and behaviors. In other words, information that is vivid, concrete, dramatic, etc., is more likely to capture our attention and sway us into believing or doing one thing rather than another. On the contrary, information that is dull or abstract is not so effective. The vividness effect relates to the vividness bias.
- What is attribution in psychology?
-
Attribution is a term describing the inferences people make when trying to explain the causes of certain events, the behavior of others, or their own behavior. Because these inferences are based not only on objective facts but also on our mental state, emotions, and past experiences, attributions can be distorted and lead to bias.
An example of such bias is hostile attribution bias, or the tendency to attribute negative intentions to others, especially when their intentions are unclear.
- How do you measure hostile attribution bias?
-
To measure hostile attribution bias, studies typically present participants with a hypothetical situation in which an individual is provoked by a peer whose behavior is purposely ambiguous. Participants are then asked to indicate the intent of the peer. This can be done through videos, pictures, audio, vignettes, or staged interactions (with actors).
Two important considerations when choosing the format are ecological validity (i.e., the extent to which the results are generalizable to a real-life setting) and social desirability bias (i.e., participants may not have wanted to report hostile attributions).
- What’s the difference between confirmation bias and recall bias?
-
Confirmation bias is the tendency to search, interpret, and recall information in a way that aligns with our pre-existing values, opinions, or beliefs. It refers to the ability to recollect information best when it amplifies what we already believe. Relatedly, we tend to forget information that contradicts our opinions.
Although selective recall is a component of confirmation bias, it should not be confused with recall bias.
On the other hand, recall bias refers to the differences in the ability between study participants to recall past events when self-reporting is used. This difference in accuracy or completeness of recollection is not related to beliefs or opinions. Rather, recall bias relates to other factors, such as the length of the recall period, age, and the characteristics of the disease under investigation.
- Why are placebos used in research?
-
Placebos are used in medical research for new medication or therapies, called clinical trials. In these trials some people are given a placebo, while others are given the new medication being tested.
The purpose is to determine how effective the new medication is: if it benefits people beyond a predefined threshold as compared to the placebo, it’s considered effective and not the result of a placebo effect.
- What causes the placebo effect?
-
Although there is no definite answer to what causes the placebo effect, researchers propose a number of explanations such as the power of suggestion, doctor-patient interaction, classical conditioning, etc.
- What are common types of selection bias?
-
Common types of selection bias are:
- What is the difference between response and nonresponse bias?
-
Response bias is a general term used to describe a number of different conditions or factors that cue respondents to provide inaccurate or false answers during surveys or interviews. These factors range from the interviewer’s perceived social position or appearance to the the phrasing of questions in surveys.
Nonresponse bias occurs when the people who complete a survey are different from those who did not, in ways that are relevant to the research topic. Nonresponse can happen because people are either not willing or not able to participate.
- What is the difference between observer bias and actor–observer bias?
-
Observer bias occurs when the researcher’s assumptions, views, or preconceptions influence what they see and record in a study, while actor–observer bias refers to situations where respondents attribute internal factors (e.g., bad character) to justify other’s behavior and external factors (difficult circumstances) to justify the same behavior in themselves.
- Why is bias in research a problem?
-
Research bias affects the validity and reliability of your research findings, leading to false conclusions and a misinterpretation of the truth. This can have serious implications in areas like medical research where, for example, a new form of treatment may be evaluated.
- What is the difference between stratified and cluster sampling?
-
Stratified and cluster sampling may look similar, but bear in mind that groups created in cluster sampling are heterogeneous, so the individual characteristics in the cluster vary. In contrast, groups created in stratified sampling are homogeneous, as units share characteristics.
Relatedly, in cluster sampling you randomly select entire groups and include all units of each group in your sample. However, in stratified sampling, you select some units of all groups and include them in your sample. In this way, both methods can ensure that your sample is representative of the target population.
- What is a sampling method?
-
When your population is large in size, geographically dispersed, or difficult to contact, it’s necessary to use a sampling method.
This allows you to gather information from a smaller part of the population (i.e., the sample) and make accurate statements by using statistical analysis. A few sampling methods include simple random sampling, convenience sampling, and snowball sampling.
- What is the definition of social desirability bias?
-
Social desirability bias is a type of response bias that occurs when survey respondents provide answers according to society’s expectations, rather than their own beliefs or experiences.
It is especially likely to occur in self-report questionnaires, as well as in any type of behavioral research, particularly if the participants know they’re being observed. This research bias can distort your results, leading to over-reporting of socially desirable behaviors or attitudes and under-reporting of socially undesirable behaviors or attitudes.
- What is the observer-expectancy effect?
-
The observer-expectancy effect occurs when researchers influence the results of their own study through interactions with participants.
Researchers’ own beliefs and expectations about the study results may unintentionally influence participants through demand characteristics.
The observer-expectancy effect is often used synonymously with the Pygmalion or Rosenthal effect.
- How can I minimize observer bias in my research?
-
You can use several tactics to minimize observer bias.
- Use masking (blinding) to hide the purpose of your study from all observers.
- Triangulate your data with different data collection methods or sources.
- Use multiple observers and ensure interrater reliability.
- Train your observers to make sure data is consistently recorded between them.
- Standardize your observation procedures to make sure they are structured and clear.
- Can I avoid observer bias?
-
It’s impossible to completely avoid observer bias in studies where data collection is done or recorded manually, but you can take steps to reduce this type of bias in your research.
- What is observer bias?
-
Observer bias occurs when a researcher’s expectations, opinions, or prejudices influence what they perceive or record in a study. It usually affects studies when observers are aware of the research aims or hypotheses. This type of research bias is also called detection bias or ascertainment bias.
- How do you overcome attrition bias?
-
If you have a small amount of attrition bias, you can use some statistical methods to try to make up for it.
Multiple imputation involves using simulations to replace the missing data with likely values. Alternatively, you can use sample weighting to make up for the uneven balance of participants in your sample.
- How do you prevent attrition?
-
To avoid attrition, applying some of these measures can help you reduce participant dropout by making it easy and appealing for participants to stay.
- Provide compensation (e.g., cash or gift cards) for attending every session
- Minimize the number of follow-ups as much as possible
- Make all follow-ups brief, flexible, and convenient for participants
- Send participants routine reminders to schedule follow-ups
- Recruit more participants than you need for your sample (oversample)
- Maintain detailed contact information so you can get in touch with participants even if they move
- How does attrition affect external validity?
-
Attrition bias can skew your sample so that your final sample differs significantly from your original sample. Your sample is biased because some groups from your population are underrepresented.
With a biased final sample, you may not be able to generalize your findings to the original population that you sampled from, so your external validity is compromised.
- How does attrition threaten internal validity?
-
Attrition bias is a threat to internal validity. In experiments, differential rates of attrition between treatment and control groups can skew results.
This bias can affect the relationship between your independent and dependent variables. It can make variables appear to be correlated when they are not, or vice versa.
- Why is attrition bias a problem?
-
Some attrition is normal and to be expected in research. However, the type of attrition is important because systematic bias can distort your findings. Attrition bias can lead to inaccurate results because it affects internal and/or external validity.
- What is attrition bias?
-
Attrition bias is the selective dropout of some participants who systematically differ from those who remain in the study.
Some groups of participants may leave because of bad experiences, unwanted side effects, or inadequate incentives for participation, among other reasons. Attrition is also called subject mortality, but it doesn’t always refer to participants dying!
- What’s the difference between demand characteristics and social desirability bias?
-
Demand characteristics are aspects of experiments that may give away the research purpose to participants. Social desirability bias is when participants automatically try to respond in ways that make them seem likeable in a study, even if it means misrepresenting how they truly feel.
Participants may use demand characteristics to infer social norms or experimenter expectancies and act in socially desirable ways, so you should try to control for demand characteristics wherever possible.
- How do I prevent demand characteristics?
-
You can control demand characteristics by taking a few precautions in your research design and materials.
Use these measures:
- Deception: Hide the purpose of the study from participants
- Between-groups design: Give each participant only one independent variable treatment
- Double-blind design: Conceal the assignment of groups from participants and yourself
- Implicit measures: Use indirect or hidden measurements for your variables
- Why do demand characteristics matter in research?
-
Demand characteristics are a type of extraneous variable that can affect the outcomes of the study. They can invalidate studies by providing an alternative explanation for the results.
These cues may nudge participants to consciously or unconsciously change their responses, and they pose a threat to both internal and external validity. You can’t be sure that your independent variable manipulation worked, or that your findings can be applied to other people or settings.
- What are demand characteristics?
-
In research, demand characteristics are cues that might indicate the aim of a study to participants. These cues can lead to participants changing their behaviors or responses based on what they think the research is about.
Demand characteristics are common problems in psychology experiments and other social science studies because they can cause a bias in your research findings.
- How do you avoid sampling bias?
-
Using careful research design and sampling procedures can help you avoid sampling bias. Oversampling can be used to correct undercoverage bias.
- What are some types of sampling bias?
-
Some common types of sampling bias include self-selection bias, nonresponse bias, undercoverage bias, survivorship bias, pre-screening or advertising bias, and healthy user bias.
- What is sampling bias?
-
Sampling bias occurs when some members of a population are systematically more likely to be selected in a sample than others.