What Is a Fishbone Diagram? | Templates & Examples
A fishbone diagram is a problem-solving approach that uses a fish-shaped diagram to model possible root causes of problems and troubleshoot possible solutions. It is also called an Ishikawa diagram, after its creator, Kaoru Ishikawa, as well as a herringbone diagram or cause-and-effect diagram.
Fishbone diagrams are often used in root cause analysis, to troubleshoot issues in quality management or product development. They are also used in the fields of nursing and healthcare, or as a brainstorming and mind-mapping technique many students find helpful.
How to make a fishbone diagram
A fishbone diagram is easy to draw, or you can use a template for an online version.
- Your fishbone diagram starts out with an issue or problem. This is the “head” of the fish, summarized in a few words or a small phrase.
- Next, draw a long arrow, which serves as the fish’s backbone.
- From here, you’ll draw the first “bones” directly from the backbone, in the shape of small diagonal lines going right-to-left. These represent the most likely or overarching causes of your problem.
- Branching off from each of these first bones, create smaller bones containing contributing information and necessary detail.
- When finished, your fishbone diagram should give you a wide-view idea of what the root causes of the issue you’re facing could be, allowing you to rank them or choose which could be most plausible.
Fishbone diagram templates
There are no built-in fishbone diagram templates in Microsoft programs, but we’ve made a few free ones for you to use that you can download below. Alternatively, you can make one yourself using the following steps:
- In a fresh document, go to Insert > Shapes
- Draw a long arrow from left to right, and add a text box on the right-hand side. These serve as the backbone and the head of the fish.
- Next, add lines jutting diagonally from the backbone. These serve as the ribs, or the contributing factors to the main problem.
- Next, add horizontal lines jutting from each central line. These serve as the potential causes of the problem.
Lastly, add text boxes to label each function.
You can try your hand at filling one in yourself using the various blank fishbone diagram templates below, in the following formats:
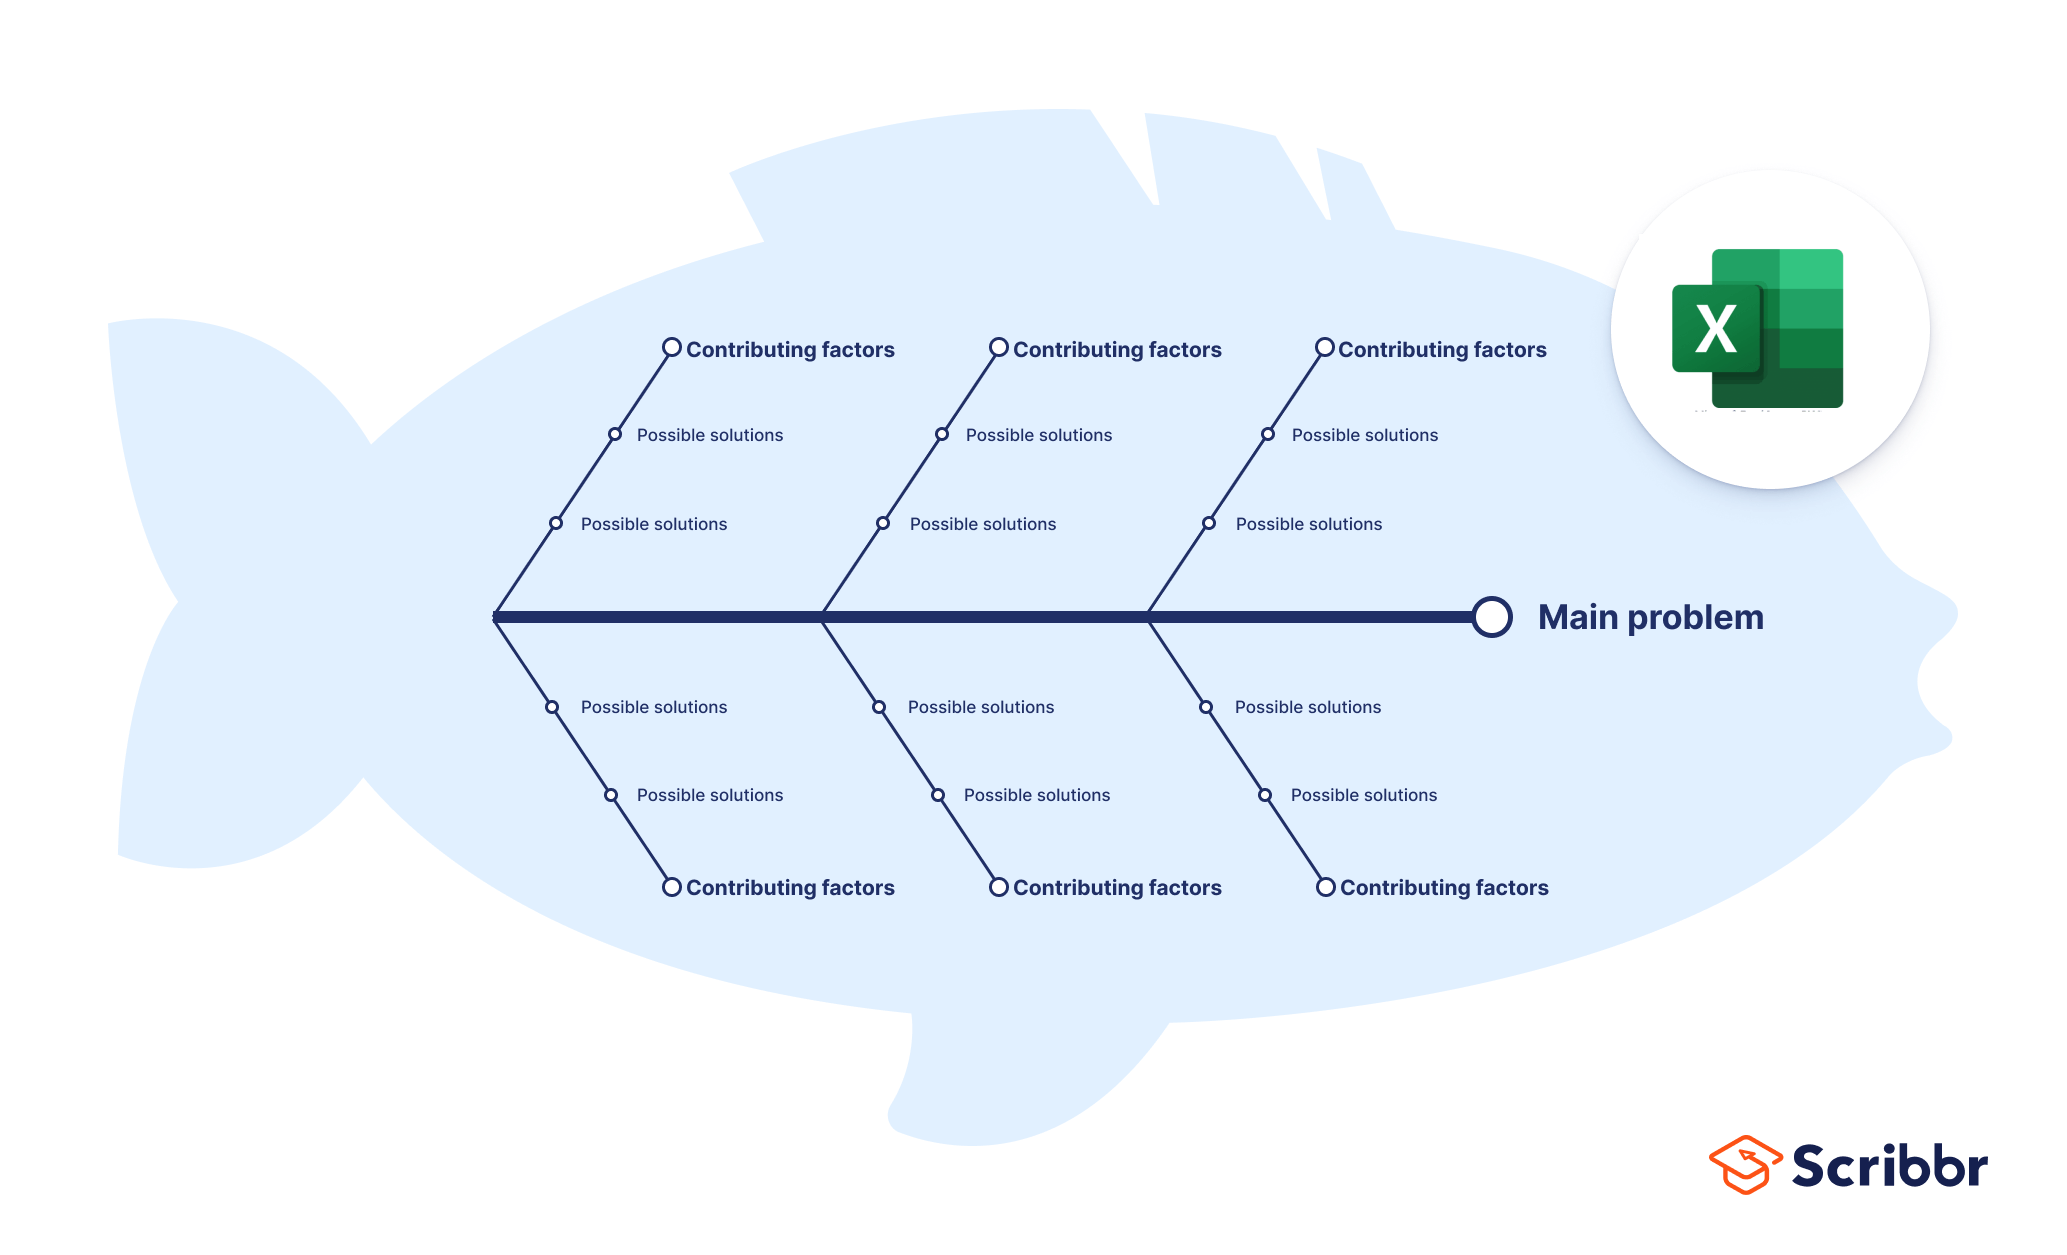
Fishbone diagram template Excel
Download our free Excel template below!
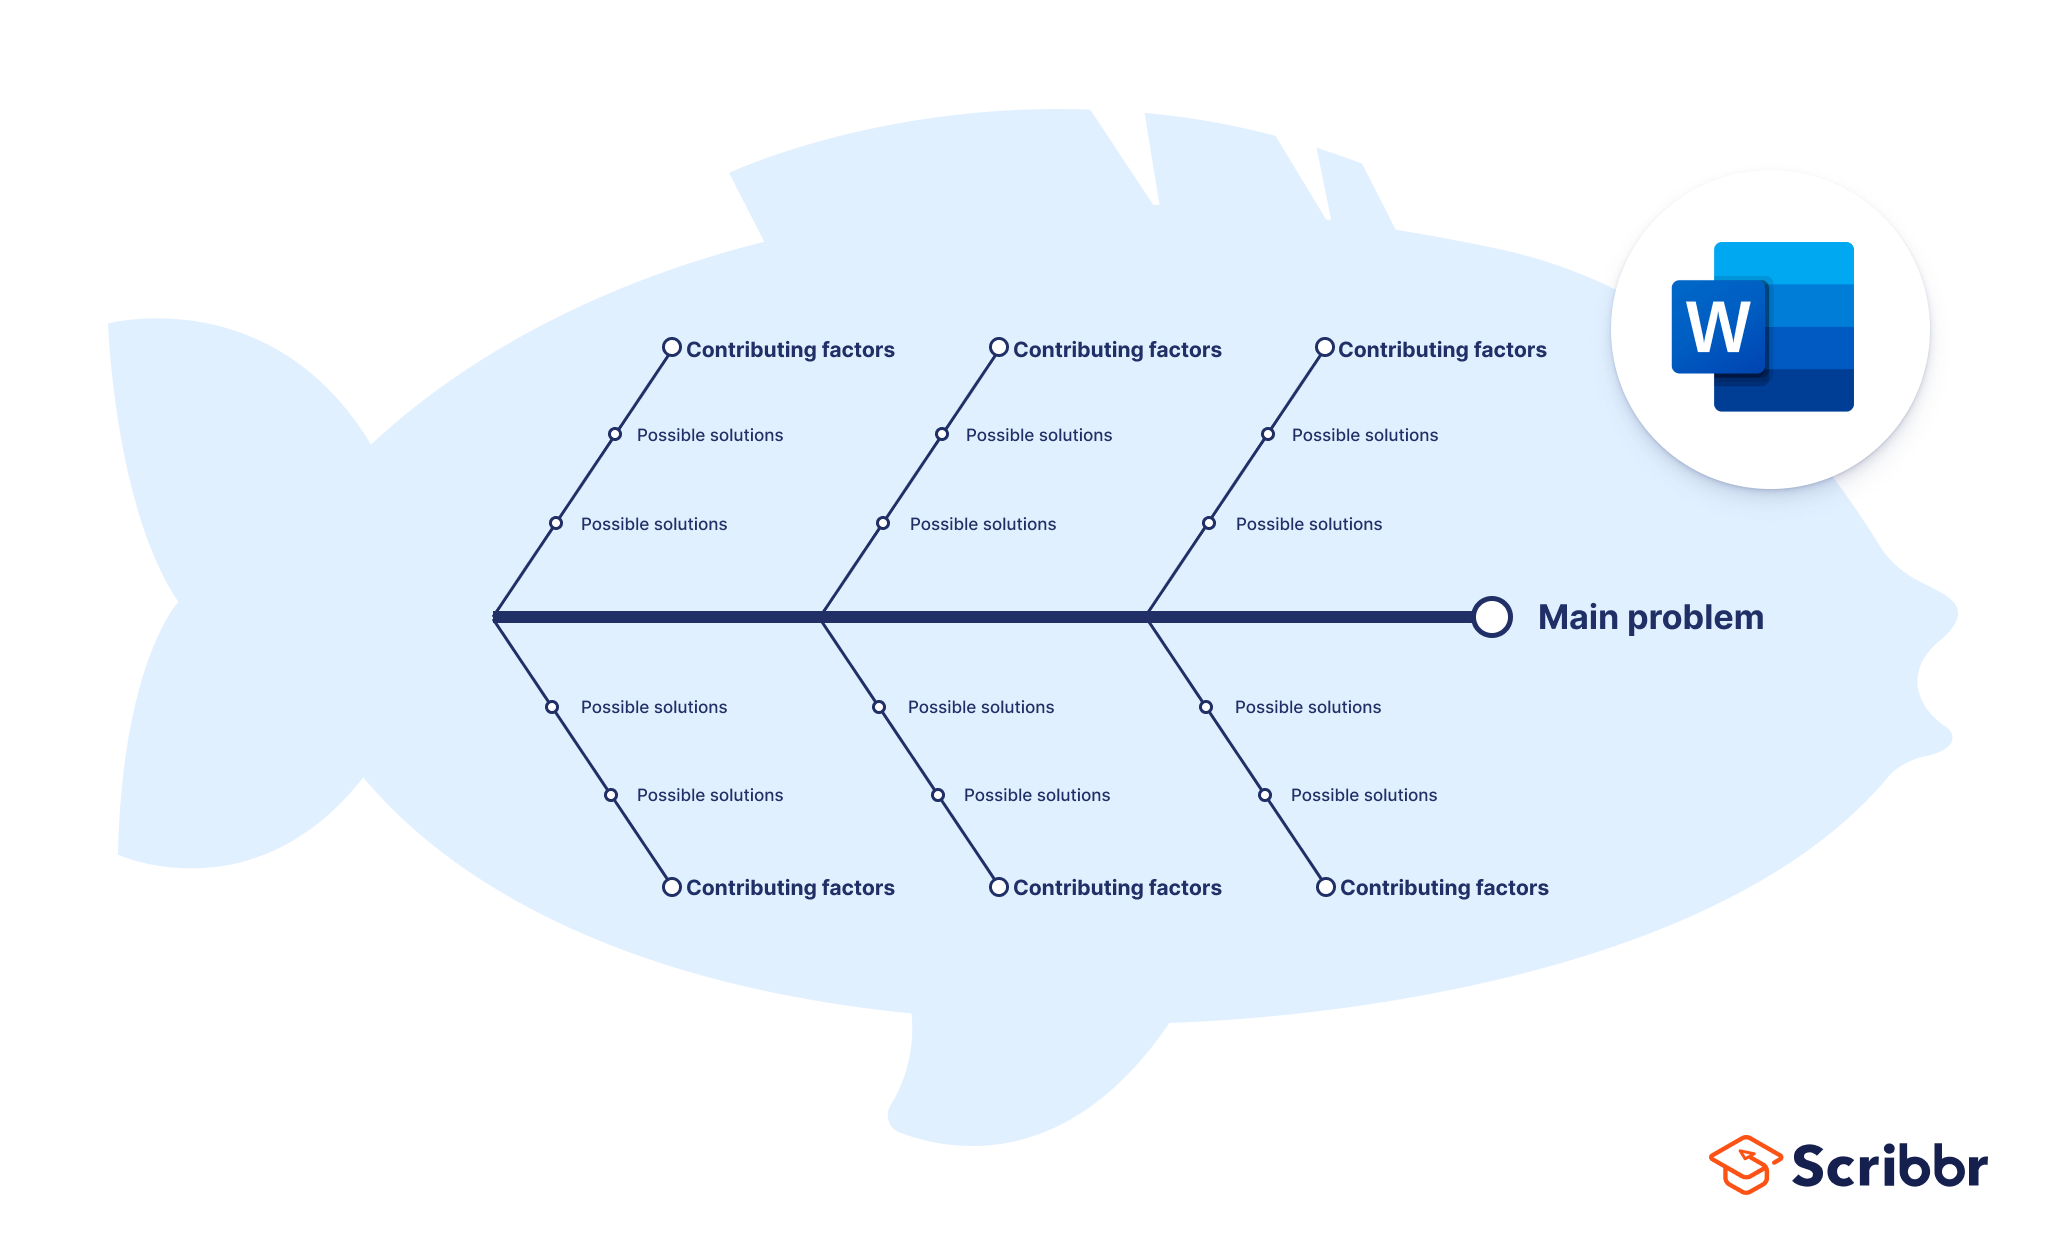
Fishbone diagram template Word
Download our free Word template below!
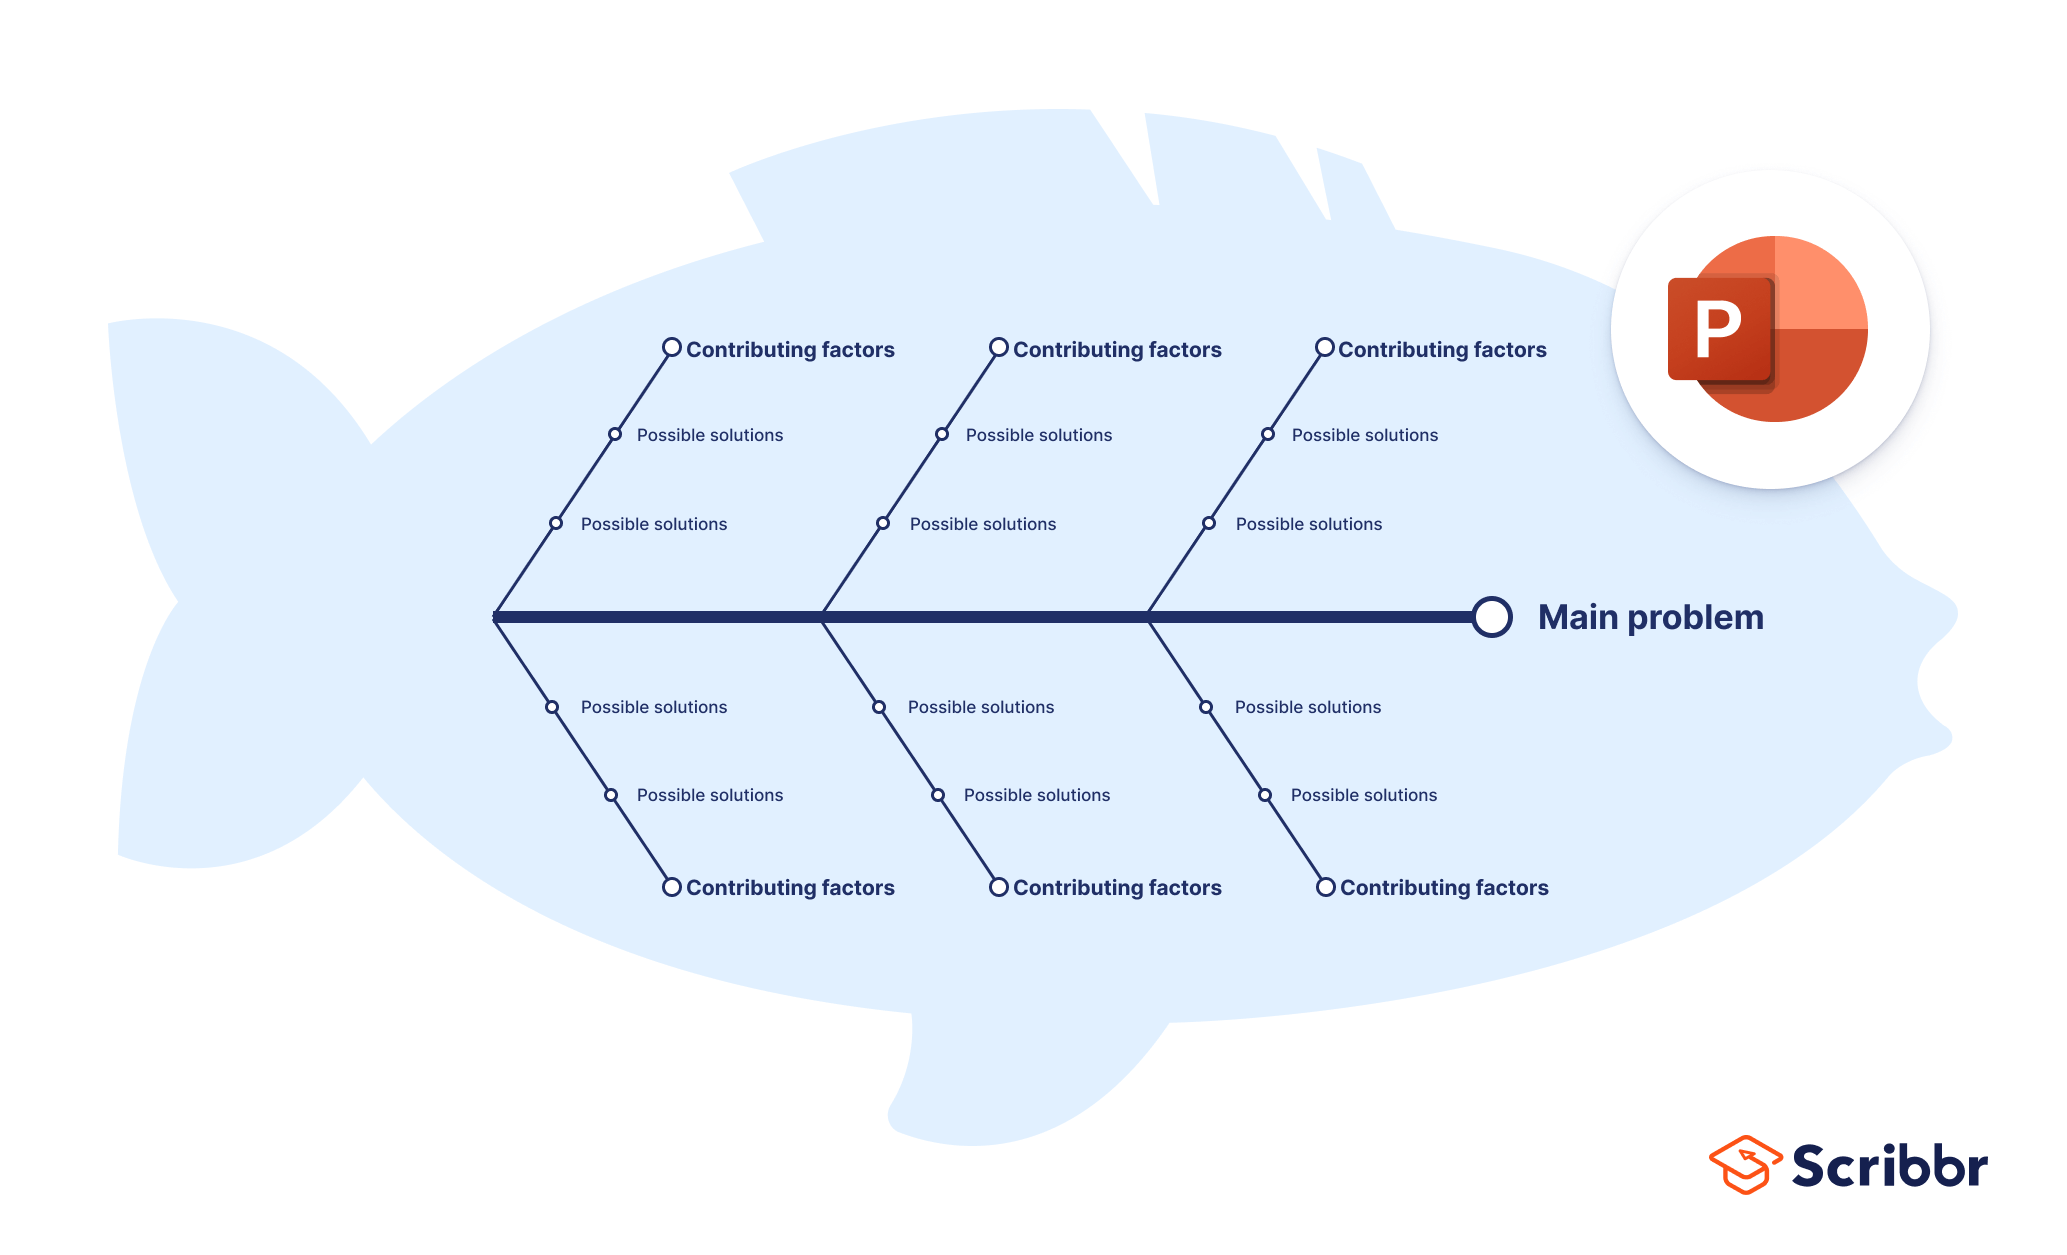
Fishbone diagram template PowerPoint
Download our free PowerPoint template below!
Fishbone diagram examples
Fishbone diagrams are used in a variety of settings, both academic and professional. They are particularly popular in healthcare settings, particularly nursing, or in group brainstorm study sessions. In the business world, they are an often-used tool for quality assurance or human resources professionals.
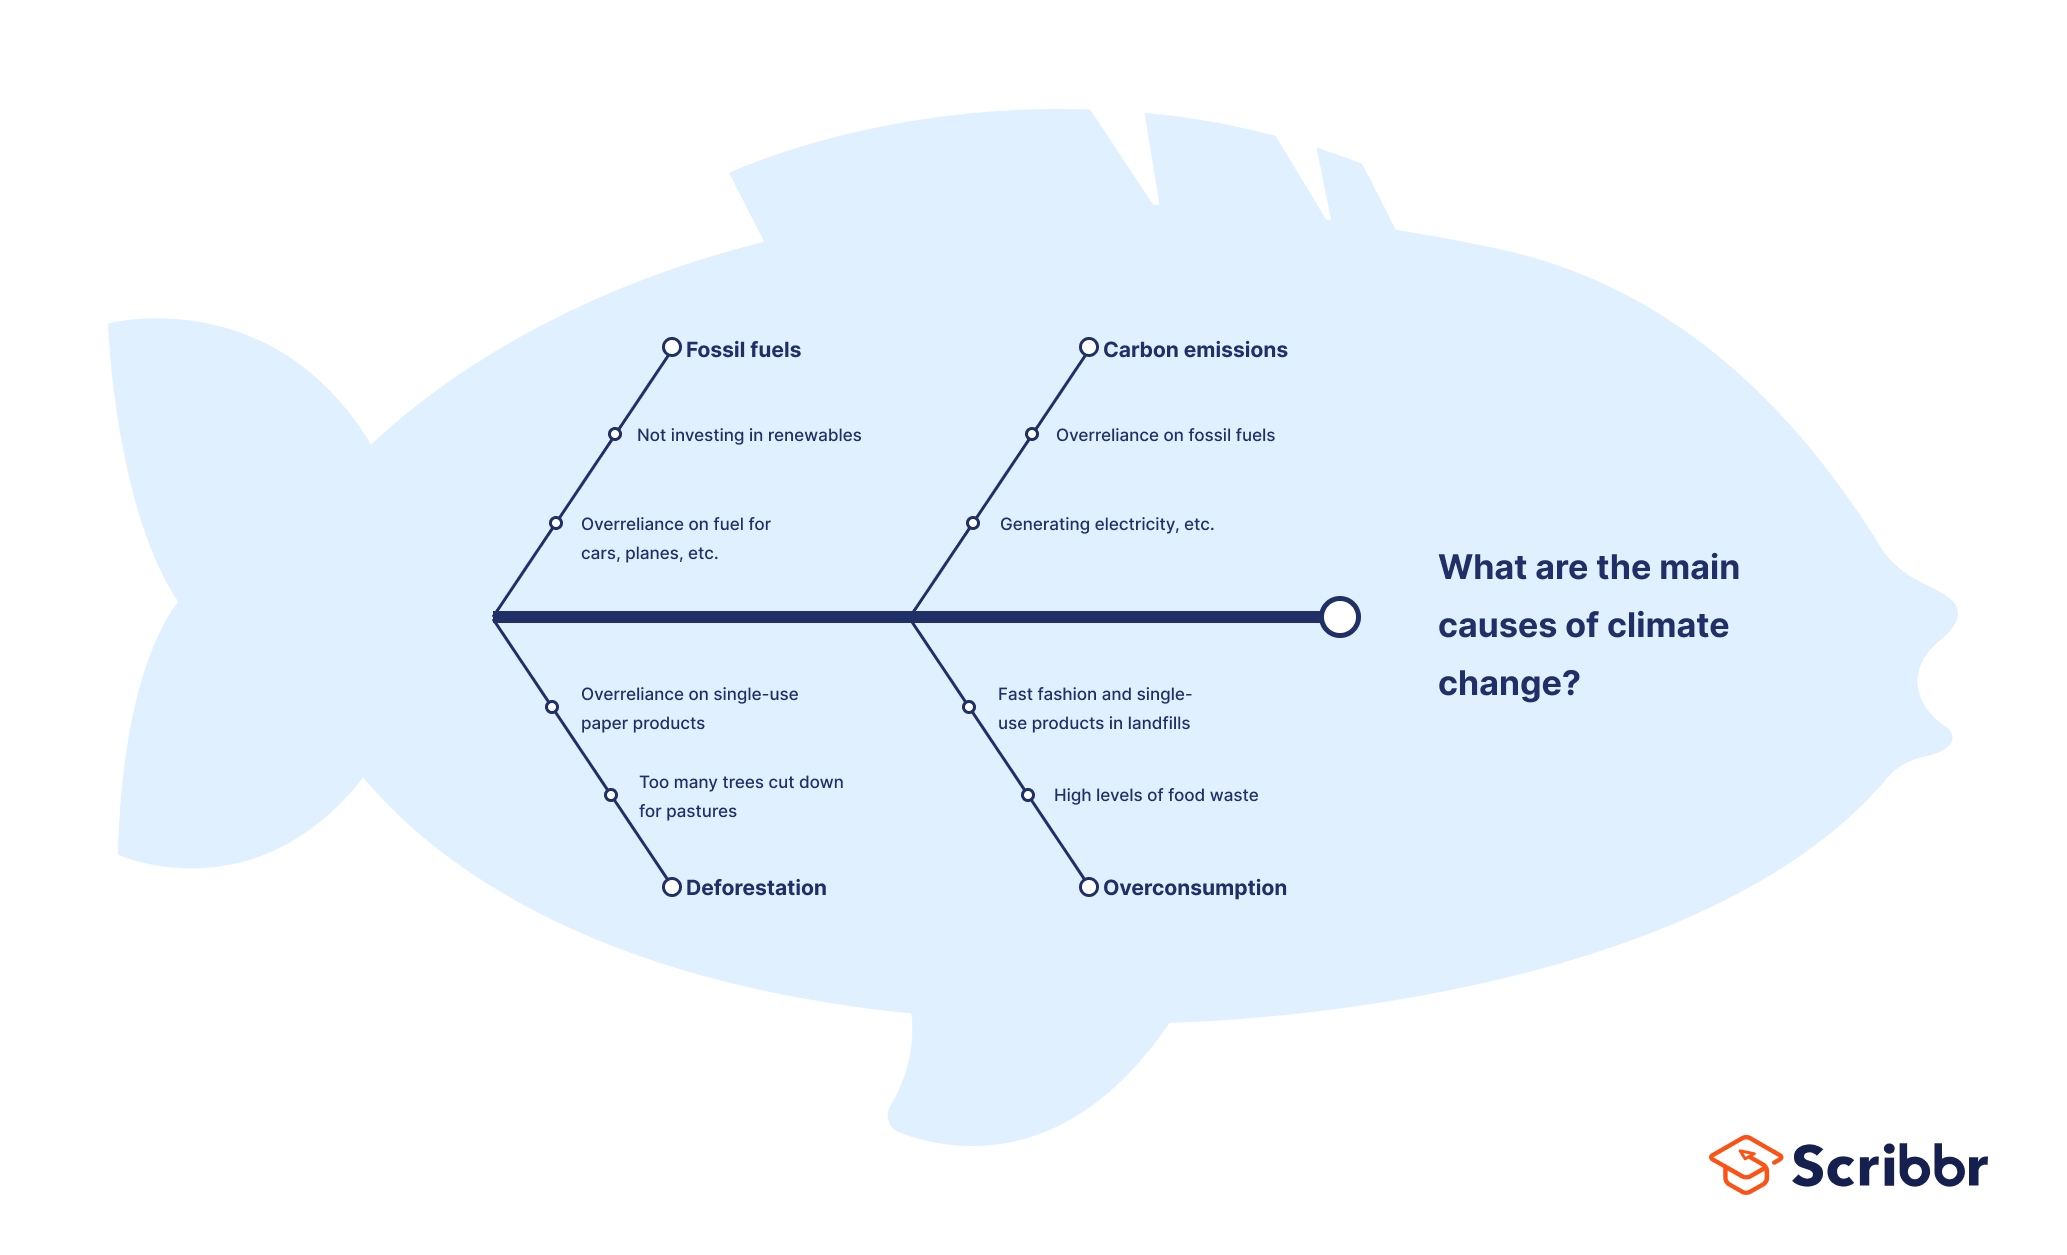
Fishbone diagram example #1: Climate change
Let’s start with an everyday example: what are the main causes of climate change?
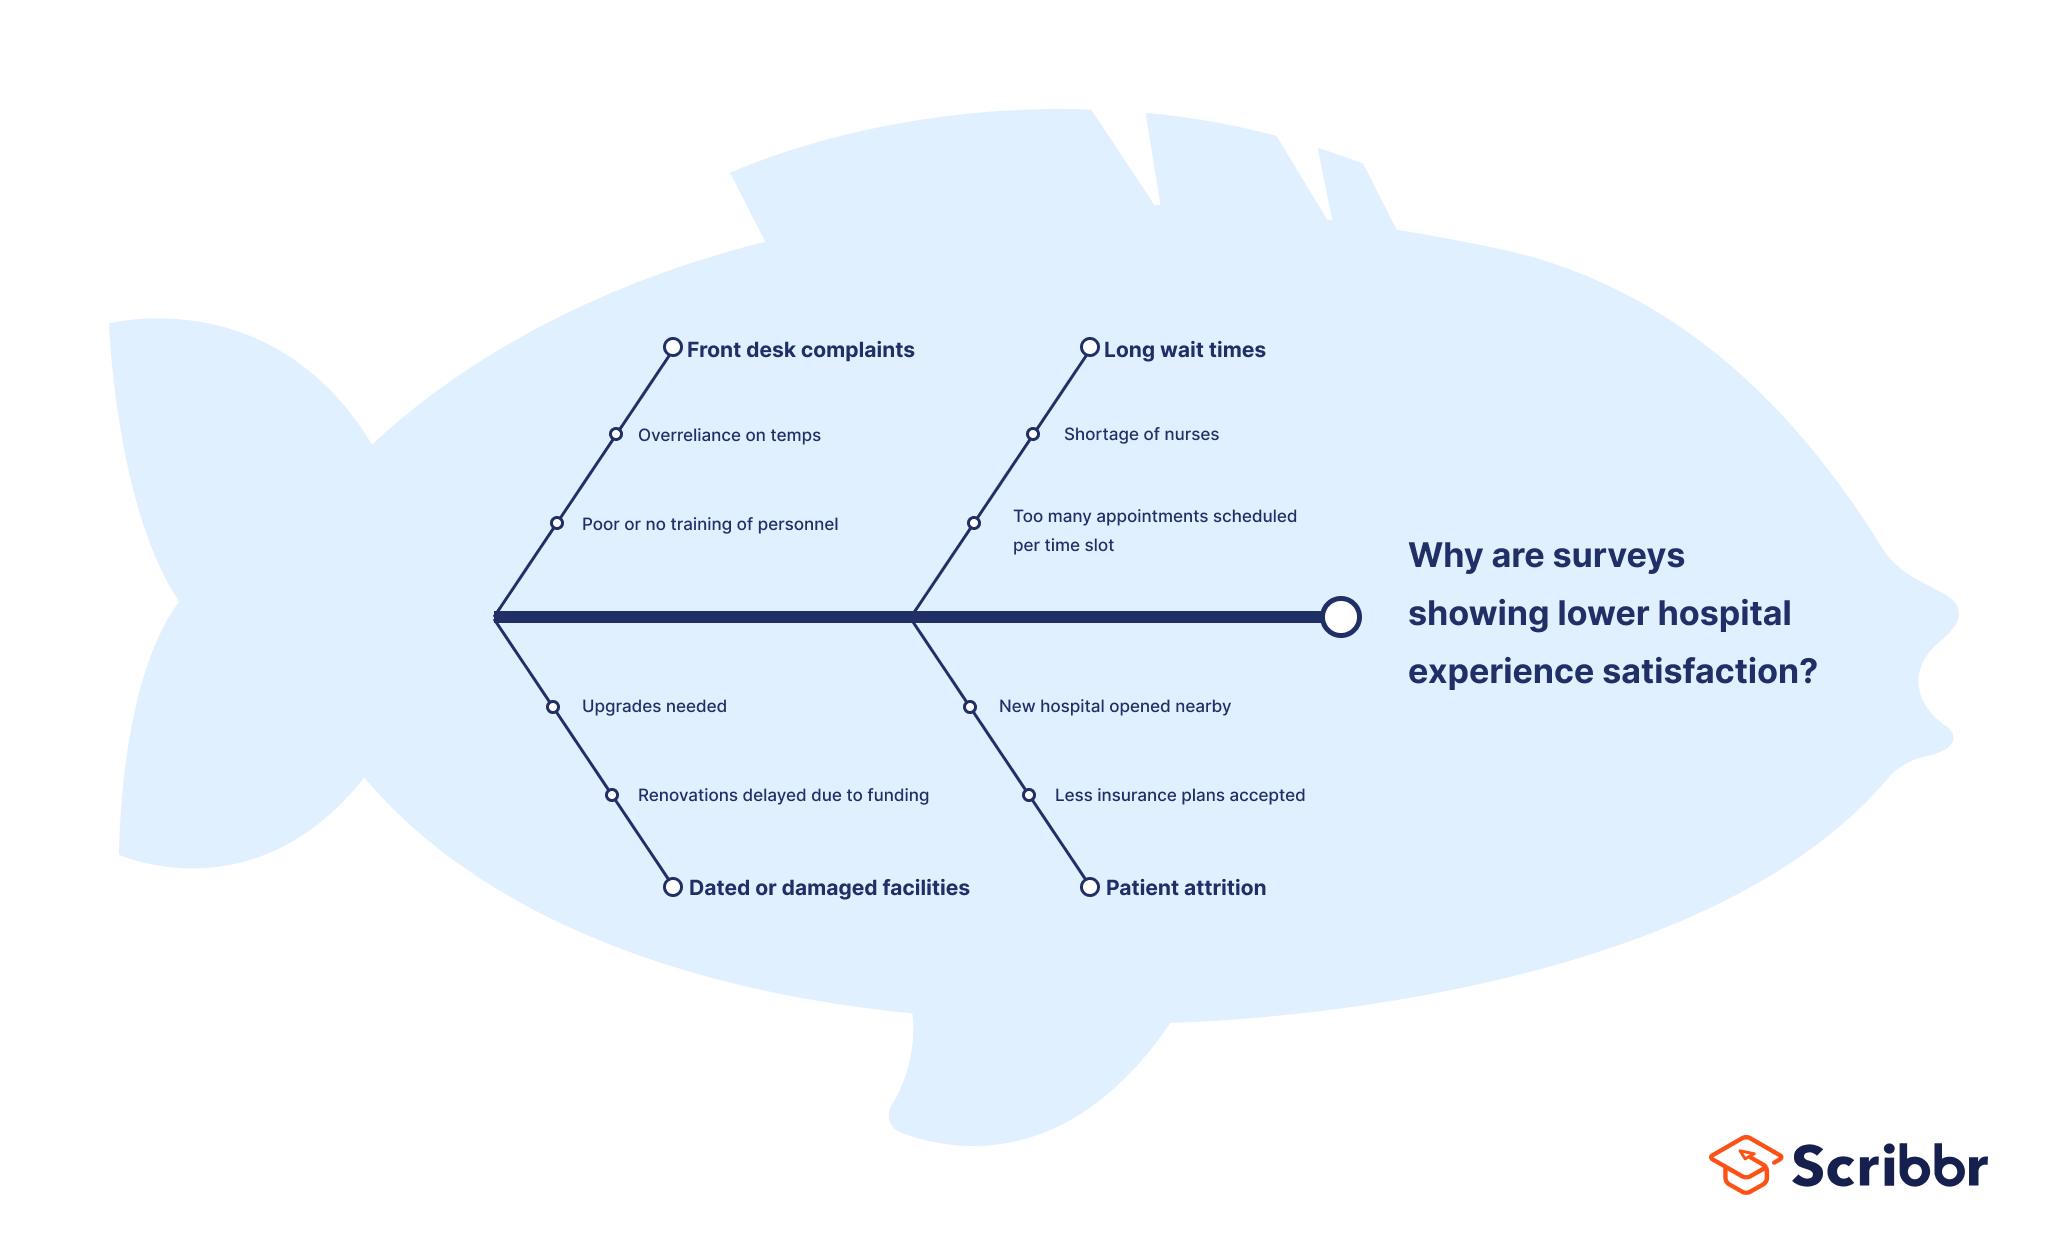
Fishbone diagram example #2: Healthcare and nursing
Fishbone diagrams are often used in nursing and healthcare to diagnose patients with unclear symptoms, or to streamline processes or fix ongoing problems. For example: why have surveys shown a decrease in patient satisfaction?
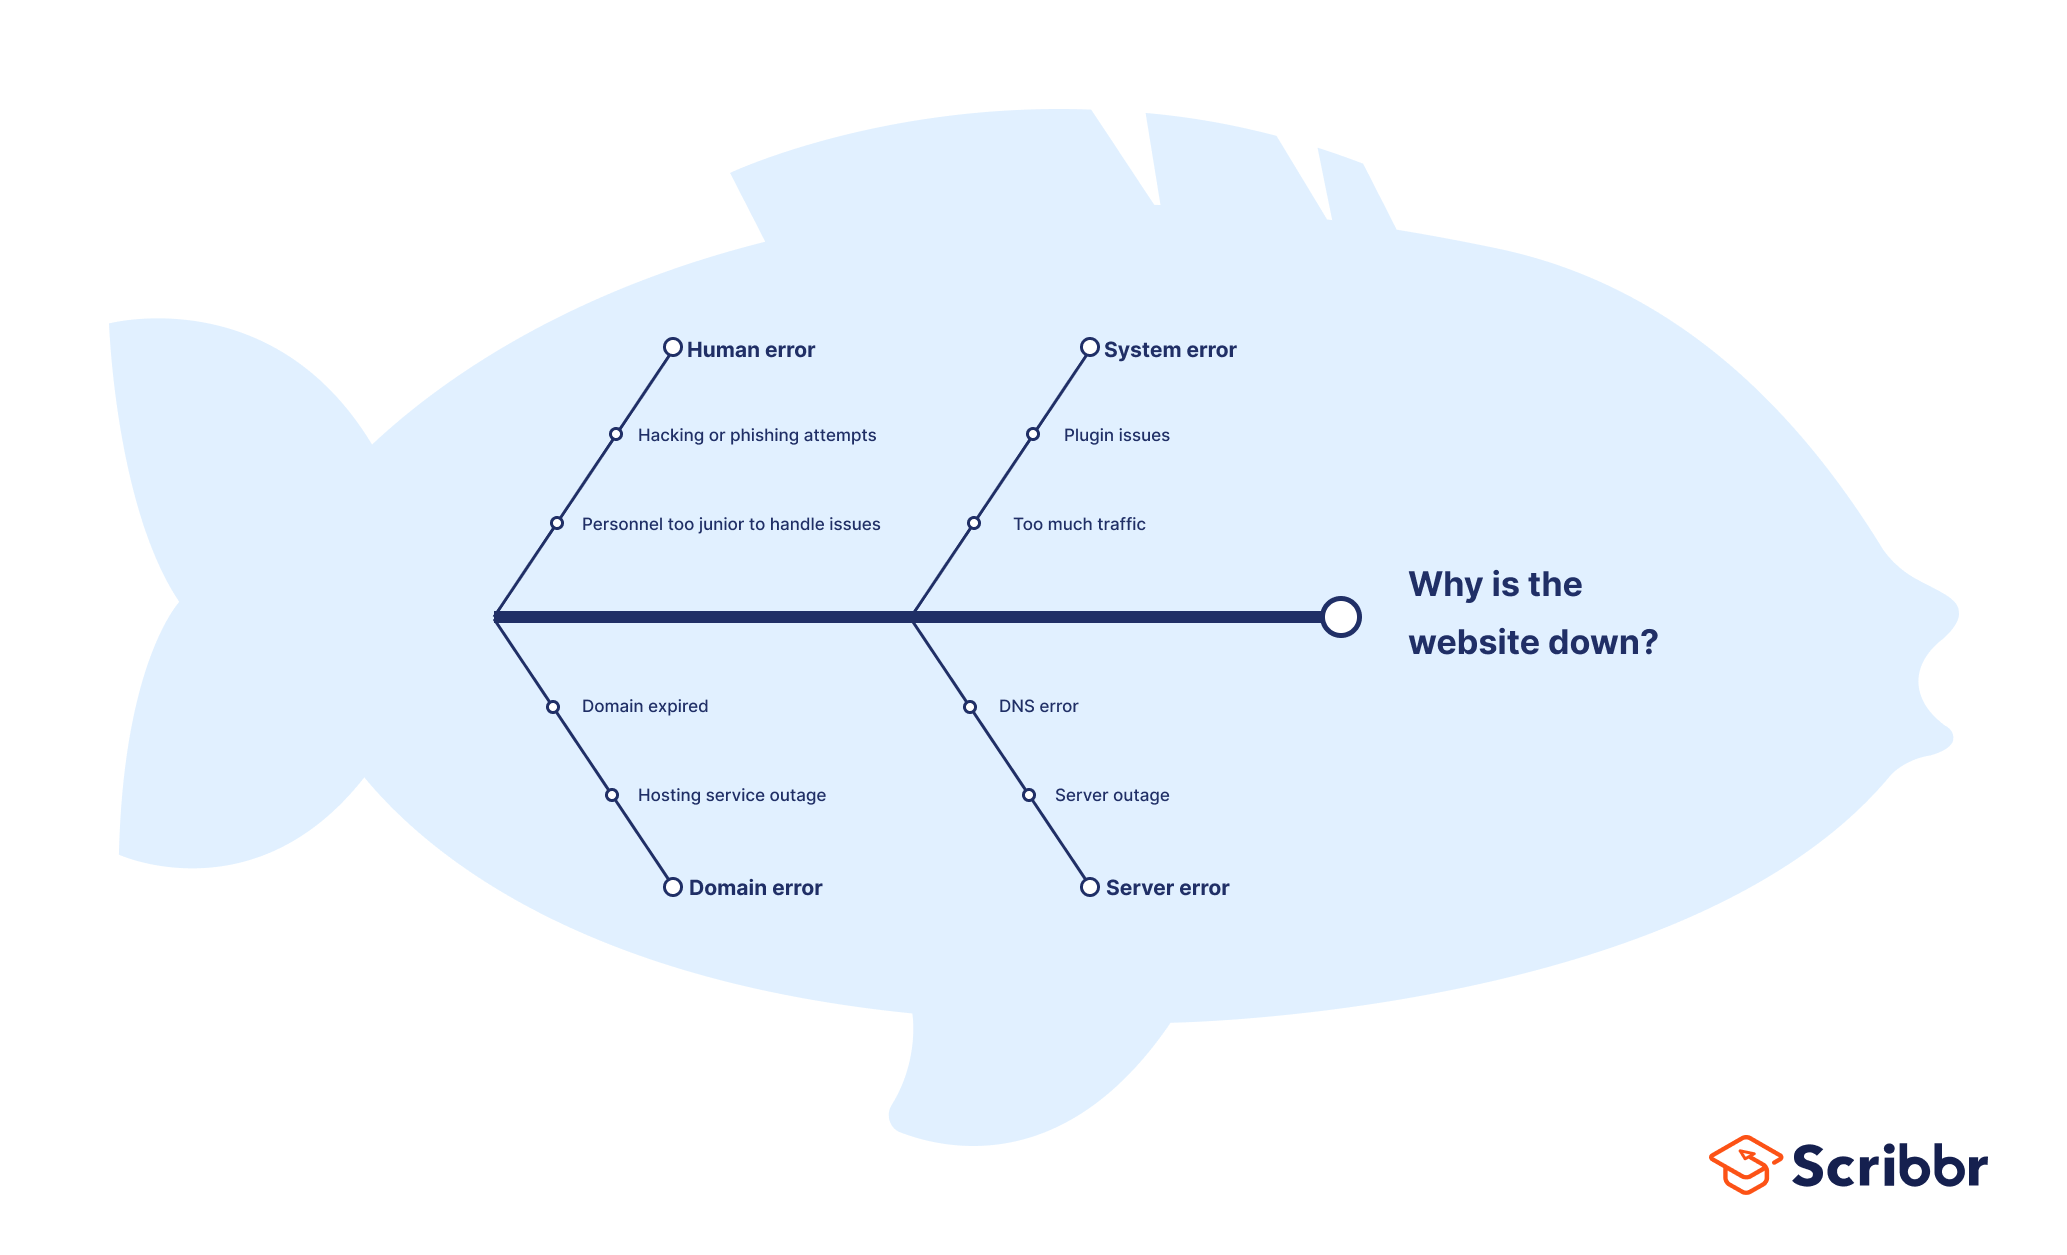
Fishbone diagram example #3: Quality assurance
QA professionals also use fishbone diagrams to troubleshoot usability issues, such as: why is the website down?
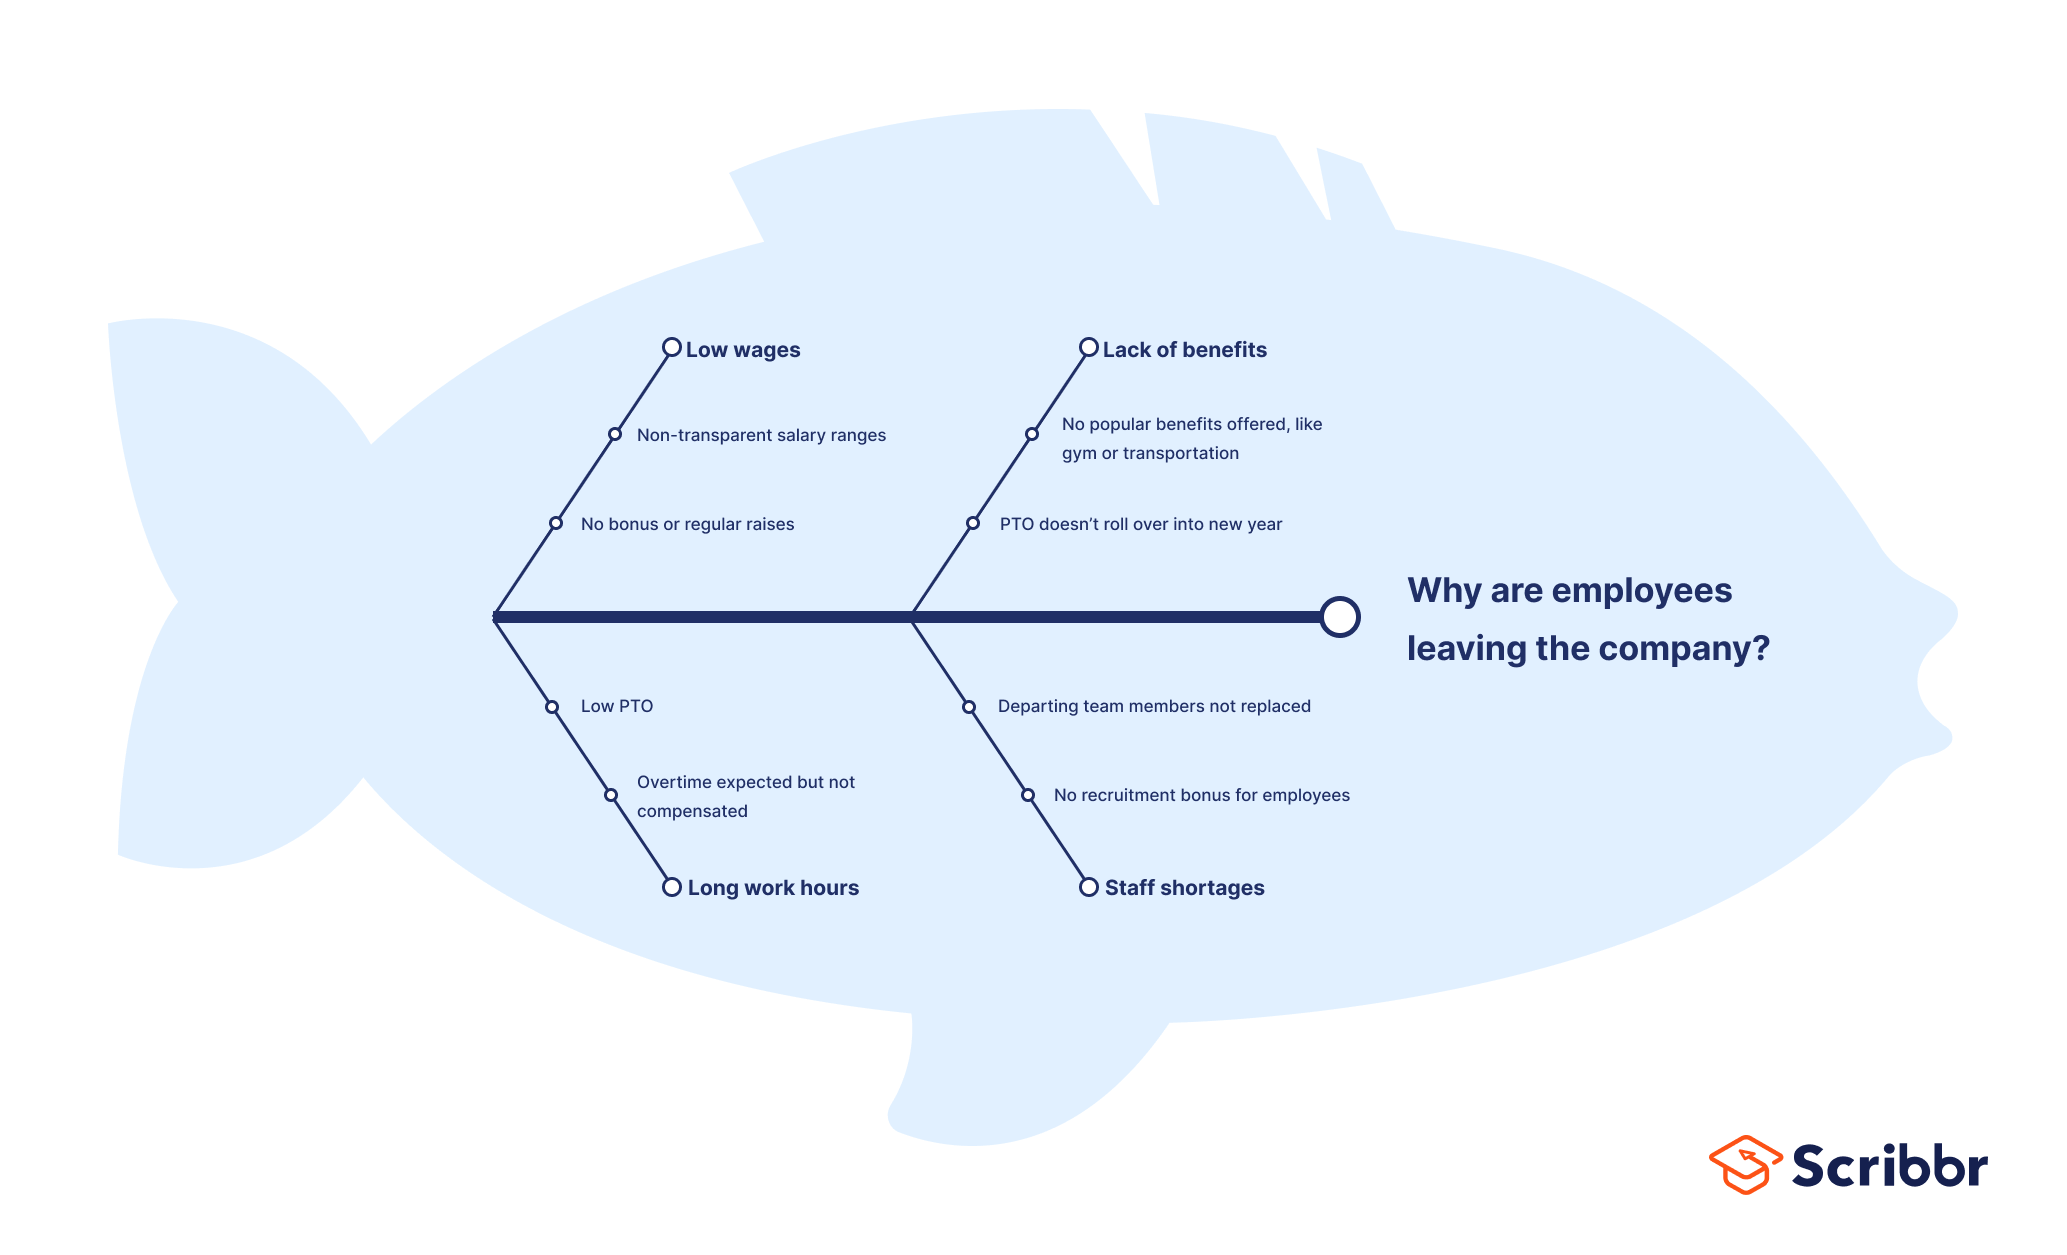
Fishbone diagram example #4: HR
Lastly, an HR example: why are employees leaving the company?
Advantages and disadvantages of fishbone diagrams
Fishbone diagrams come with advantages and disadvantages.
Advantages
- Great tool for brainstorming and mind-mapping, either individually or in a group project.
- Can help identify causal relationships and clarify relationships between variables.
- Constant iteration of “why” questions really drills down to root problems and elegantly simplifies even complex issues.
Disadvantages
- Can lead to incorrect or inconsistent conclusions if the wrong assumptions are made about root causes or the wrong variables are prioritized.
- Fishbone diagrams are best suited to short phrases or simple ideas—they can get cluttered and confusing easily.
- Best used in the exploratory research phase, since they cannot provide true answers, only suggestions.
Other interesting articles
If you want to know more about the research process, methodology, research bias, or statistics, make sure to check out some of our other articles with explanations and examples.
Methodology
Statistics
Frequently asked questions about fishbone diagrams
Cite this Scribbr article
If you want to cite this source, you can copy and paste the citation or click the “Cite this Scribbr article” button to automatically add the citation to our free Citation Generator.
George, T. (2024, January 29). What Is a Fishbone Diagram? | Templates & Examples. Scribbr. Retrieved June 23, 2026, from https://www.scribbr.com/research-process/fishbone-diagram/
